
Your Business Data Is Everywhere. Your Dashboard Shouldn't Be.
Most service business owners we talk to have the same problem. Their CRM has lead data. Their scheduling tool has job data. Their accounting software has revenue data. And none of them talk to each other.
The result is a weekly ritual: log into three tools, export spreadsheets, paste numbers into a fourth tool, and try to figure out whether the business is actually growing. That ritual costs 2-4 hours a week and produces a snapshot that is already stale by the time you finish.
A connected KPI dashboard changes that. It pulls data from every tool your business runs on and shows you the metrics that matter in one place, updated daily. You do not need a data engineer or a six-figure BI tool to build one.
Quick answer: A business KPI dashboard for service businesses connects your CRM, scheduling, and accounting tools into one view. It shows you lead volume, conversion rate, jobs booked, revenue per job, and cash flow without manual exports. Most service businesses can build one in 2-4 weeks using tools they already have, with no dedicated data team.
What a Service Business Dashboard Should Actually Show
The trap is building a dashboard that shows everything. More data does not mean better decisions. A useful dashboard shows the metrics that tell you whether your business is healthy today and where it is heading this month.
The Core Metrics
| Metric | Where It Comes From | Why It Matters |
|---|---|---|
| New leads per week | CRM | Tells you if marketing is working |
| Lead-to-job conversion rate | CRM + Scheduling | Tells you if your sales process is working |
| Average job value | Scheduling + Accounting | Tells you if you are pricing correctly |
| Jobs completed per week | Scheduling | Tells you if operations are keeping up |
| Revenue collected vs invoiced | Accounting | Tells you if cash flow is healthy |
| Cost per lead | CRM + Ad platform | Tells you if your ad spend is efficient |
That is six metrics. That is enough. If you track more than ten, you will stop looking at the dashboard entirely.
The One Metric Most Service Businesses Miss
Jobs completed per technician per week. This is the single best indicator of operational efficiency for field service businesses. If it drops, you have a scheduling, dispatch, or capacity problem. If it rises without quality complaints, you have room to grow without adding headcount.
How to Connect Your Tools Without a Data Team
The most common objection we hear is "I don't have anyone who can write API integrations." You do not need to. Modern integration platforms handle the heavy lifting.
Option 1: The No-Code Integration Layer
Tools like Make (formerly Integromat) and Zapier act as the middle layer between your tools. You set up a scenario that watches for new data in one tool and sends it to a dashboard tool.
Example flow: A new lead enters your CRM. Make picks up the lead data, checks the lead source field, and sends a row to your dashboard spreadsheet or database. When that lead becomes a job in your scheduling tool, Make updates the same row with the job value and status.
This approach works for businesses with 5-50 employees. It costs $30-100 per month in platform fees and takes a few days to set up.
Option 2: The Database-First Approach
If you already use a tool like Airtable, Notion, or Google Sheets as your operational hub, you can build the dashboard directly in that tool. Connect your CRM and scheduling tool to push data into the same base. Then use the tool's built-in charts or a connected visualization tool like Google Data Studio (now Looker Studio).
This approach works best when you already use one of these tools as your source of truth. It costs nothing extra beyond your existing subscription.
Option 3: The Custom Integration
For businesses with 50+ employees or complex workflows, a lightweight custom integration using webhooks and a simple database makes sense. This is where AnovaGrowth typically steps in. We build a small middleware layer that normalizes data from your tools and feeds it into a dashboard. The cost is higher upfront ($3,000-8,000 depending on complexity), but the result is a dashboard that updates in real time and never needs manual maintenance.
The Dashboard Stack That Works for Most Service Businesses
Here is the stack we recommend most often for service businesses that want a dashboard without a data team:
- Data source: Your existing CRM (HubSpot, Jobber, Housecall Pro, Salesforce)
- Integration layer: Make ($9-29/month for the plan you need)
- Storage: Google Sheets or Airtable (free or $10-20/month)
- Visualization: Looker Studio (free) or a simple Google Sheets chart tab
Total additional cost: $10-50/month. Setup time: 2-5 days for a basic version, 2-4 weeks for a polished version with historical data.
What this looks like in practice: A plumbing company with 12 technicians connects their CRM (Jobber) to a Google Sheet via Make. The sheet updates every time a lead comes in, a job is scheduled, or an invoice is paid. A Looker Studio dashboard pulls from the sheet and shows the owner a single screen with lead volume, conversion rate, jobs completed, and revenue. The owner checks it once per day instead of logging into three tools.
What to Do Before You Build the Dashboard
The most common dashboard failure is not technical. It is that the data in your tools is messy or incomplete. Before you connect anything, fix these three things:
Clean Your Lead Sources
If your CRM has leads labeled "website," "referral," "Google," "call-in," and "other," and some of those are duplicates or miscategorized, your dashboard will show you wrong numbers. Standardize your lead source list to 4-6 categories. Map existing leads to the right category. Then set up your forms and intake process to enforce the correct category going forward.
Define Your Stages
Your CRM probably has pipeline stages like "new lead," "contacted," "quote sent," "negotiating," "won," and "lost." Make sure every lead is in exactly one stage and that your team moves leads through stages consistently. A lead that sits in "new lead" for three months after a quote was sent will break your conversion rate calculation.
Set Up Your Job Statuses
Your scheduling tool needs clear, mutually exclusive statuses. "Scheduled," "in progress," "completed," "invoiced," and "paid" are the minimum. If your team uses "done" and "finished" interchangeably, pick one and clean up the data.
First-Hand Insight: The Dashboard That Changed How We Operate
At AnovaGrowth, we run our own operations on a connected dashboard. It pulls data from our CRM (HubSpot), our project management tool (Linear), and our invoicing tool. The single most valuable thing it shows us is the ratio of active projects to available capacity.
Before we had this dashboard, we would take on new work based on gut feel. "Are we busy?" was answered by whoever was loudest in the morning standup. After the dashboard, we could see exactly how many hours of capacity we had each week. That changed how we scope projects, how we set timelines, and how we say no to work that would stretch us too thin.
For service businesses, that same principle applies. The dashboard does not just show you what happened. It shows you what you have room for.
Common Questions About Service Business Dashboards
Do I need a data warehouse?
No. A data warehouse (Snowflake, BigQuery, Redshift) is overkill for a service business with under 100 employees. A connected spreadsheet or Airtable base handles everything you need.
How often should the dashboard update?
Daily is enough for most service businesses. Real-time updates sound nice but rarely change decisions. If you check your dashboard once per day and the data is from the previous day, you have everything you need.
What if my tools don't have API access?
Most modern service business tools have API access or webhook support. If yours does not, check whether it can export to CSV or Google Sheets automatically. Many tools have a built-in "export to spreadsheet" feature that runs on a schedule.
Can I build this myself?
Yes, if you are comfortable with basic spreadsheet formulas and following step-by-step integration tutorials. If that sounds like a project you will never get to, that is where a partner like AnovaGrowth comes in. We can build the integration and dashboard in a few days and hand you a login link.
How do I know which metrics to track?
Start with the six metrics listed above. Use them for 30 days. After that, you will know which ones matter most to your specific business and which ones you can drop or add.
What is the ROI of a dashboard?
A service business owner who saves 3 hours per week on manual reporting and spreadsheet work is saving 150 hours per year. At $100/hour owner time, that is $15,000 in reclaimed time. The dashboard itself costs $10-50/month or a one-time setup fee. The ROI calculation is straightforward.
The Bottom Line
A connected KPI dashboard is not a luxury for service businesses. It is the difference between running your business on last week's spreadsheet and running it on today's data. The tools to build one are cheap, the setup is fast, and the payoff is immediate.
If you are spending more than 30 minutes per week pulling reports from different tools, you have already justified the investment. The question is not whether to build a dashboard. It is whether you build it yourself or have someone build it for you.
Ready to connect your business data? Contact us to discuss how we can build a KPI dashboard that pulls your CRM, scheduling, and financial data into one view. Or read about CRM integration for service businesses to start with the data foundation.
Related reading:
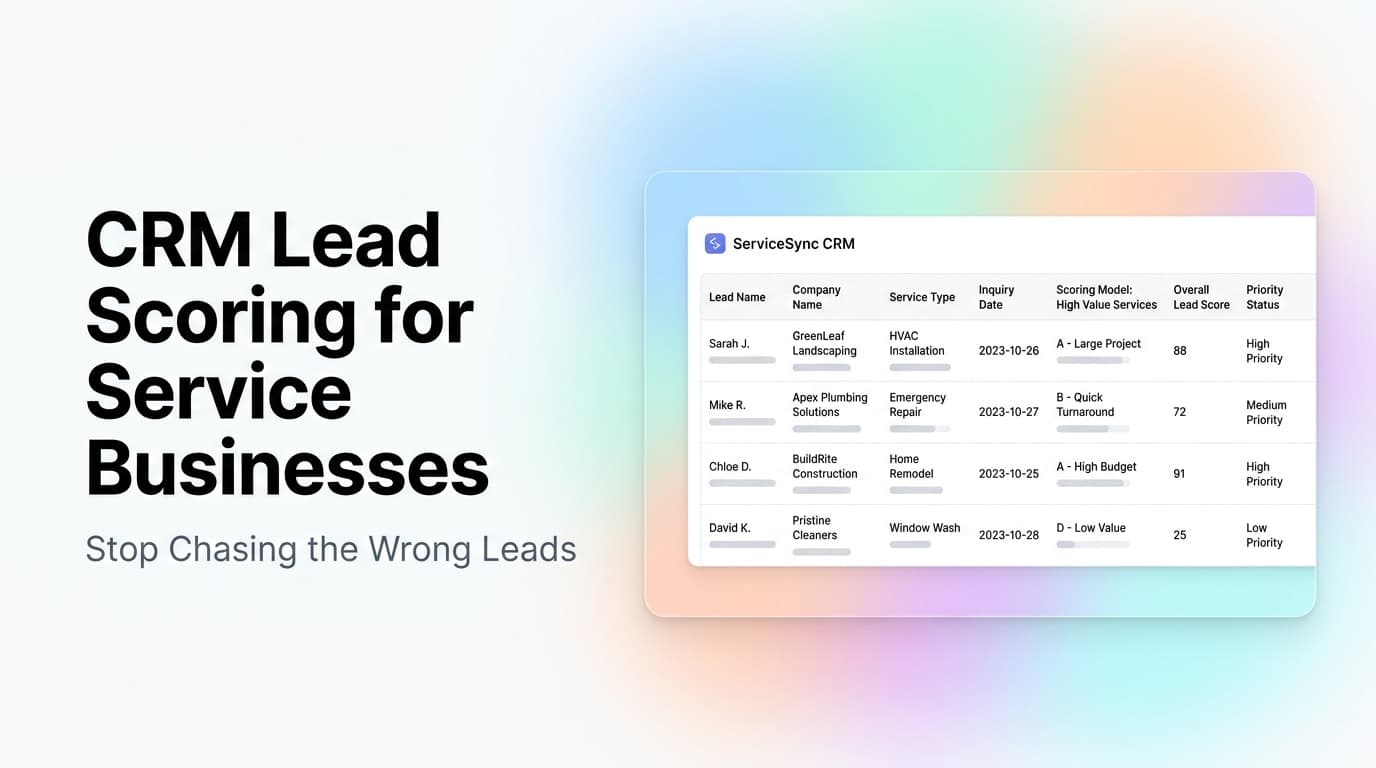
- CRM Lead Scoring for Service Businesses - Prioritize the leads that actually convert
- The 7 Workflow Bottlenecks AI Automation Should Fix First - Find the processes that need automation before the dashboard
- How to Audit a Workflow Before You Automate It - Clean up your processes before connecting your tools