Quick Answer
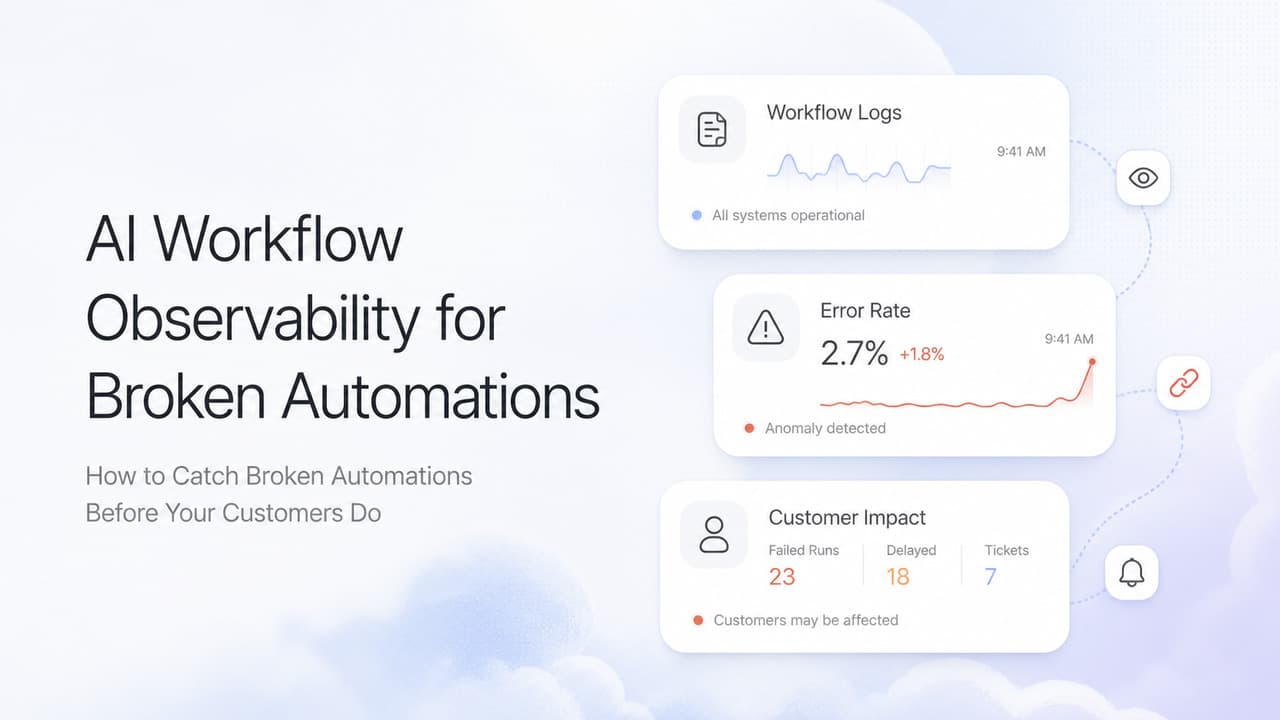
AI workflow observability means watching your automations in real time so you know when they break, why they broke, and which customers are affected. AI workflows fail more than traditional software because they sit on three unstable layers: a model that returns unexpected output, an API that rate-limits or changes shape, and a data source that drifts. A practical stack has three layers: run logs, error rates, and customer-visible signals. With those, you catch failures in minutes instead of days.
The Silent Failure Tax on Every AI Deployment
Most business owners who deploy AI automations have the same blind spot. They watch the first few runs work, declare victory, and move on. Then a customer mentions three weeks later that the chatbot has been answering the wrong way, or the lead routing has been sending hot prospects to a generic inbox, or the invoice follow-up has been stuck since a Tuesday afternoon when an upstream API hiccuped.
AI workflows fail silently more than any other software we build. The reason is structural. Traditional software fails loud. A database query errors out, an exception bubbles up, a 500 lands in a log. AI workflows have three independent failure surfaces stacked on top of each other, and each one can break without the others knowing:
- The model layer can return malformed JSON, hallucinate a field, or quietly change tone after a provider update.
- The integration layer can hit a rate limit, change auth, deprecate an endpoint, or return a different schema.
- The data layer can drift when your CRM updates a field name, a CSV gets a new column, or a webhook signature rotates.
Any one of these can fail in isolation. The user sees a slow reply, a wrong answer, or no reply at all. Most internal tools do not know anything is wrong because the workflow technically "succeeded" from the platform's point of view.
We have walked into client engagements where the AI phone agent was answering 40 percent of calls with a hallucinated script for six weeks before anyone noticed, because nobody was listening to the calls. We have seen lead-scoring workflows push hot leads into a generic nurture sequence for a month because a Zapier step silently failed and was marked "successful" by the platform.
The fix is not more AI. The fix is observability.
What Actually Breaks in an AI Workflow
Before you build a monitoring stack, you need a taxonomy of the failures you are actually trying to catch. Most of the incidents we see at client sites fall into one of seven categories:
| Failure Type | What Happens | How You Notice | How Often |
|---|---|---|---|
| Hallucinated output | Model returns a confident but wrong answer | Customer complains or escalates | 1 to 5 percent of runs |
| Schema drift | Provider changes API response shape | Workflow errors out at next step | Once per quarter per integration |
| Rate limit | Provider throttles you for traffic burst | Workflow timeouts spike | Monthly during traffic peaks |
| Auth expiry | OAuth token, API key, or webhook secret rotates | All runs fail suddenly | Once or twice a year per integration |
| Data drift | Upstream field renames, gets blank, or moves | Silent for days, then customer reports a problem | Weekly in fast-moving CRMs |
| Prompt drift | Model behavior shifts after a provider update | Quality scores drop without code changes | Monthly for hosted models |
| Partial success | One branch fails, the rest succeeds | Records update partially, leaving inconsistent state | Daily in complex flows |
Notice that only three of these seven surface as a hard error. The other four look like "success" to the platform. They only become visible through pattern analysis or, worse, through a customer telling you something is off.
That is the core problem observability has to solve.
The Three Layers of a Working Observability Stack
There is no single tool that catches every failure. A serious observability stack has three layers, each watching a different angle.
| Layer | What It Watches | Tool Examples | When It Fires |
|---|---|---|---|
| Run logs | Every workflow execution with inputs, outputs, step outcomes, timing, and correlation ID | LangSmith, Helicone, custom Postgres table, n8n execution logs | Always on, append-only |
| Error rates | Aggregated counts of failures, retries, timeouts, and unexpected outputs grouped by workflow and step | Datadog, Grafana, OpenObserve, a daily cron with SQL | Hourly aggregates, alerts on threshold breach |
| Customer-visible signals | Latency, completion rate, response quality, missed-message count, customer sentiment trend | PostHog, Hotjar, custom dashboards, weekly call sampling | Continuous, alerts when SLAs slip |
Why All Three
Run logs answer "what happened on this specific run?" without which you cannot debug anything. Error rates answer "is something systemic going wrong right now?" so you catch the slow leak before customers do. Customer-visible signals answer "what is the actual user experience?" which is the only metric that matters in the end.
If you only have one layer, pick run logs. They are the foundation. Without them, the other two layers become guesswork.
If you have two, add error rates. Most teams add this layer in week two and catch their first real incident in week three.
The third layer, customer-visible signals, is what separates a working AI workflow from a great one. It is also the layer most teams skip because it requires defining what "good" looks like in numbers.
Building Your First Alert Stack in One Day
You do not need a six-week observability project. You can ship a working alert stack in a day. Here is the sequence we use for new AI deployments.
Step 1: Instrument Every Run
Every AI workflow execution should write a row to a log table with at minimum:
- A unique run ID
- The workflow name and current step
- Input prompt (truncated for privacy)
- Output or error message
- Latency in milliseconds
- Token usage and estimated cost
- A correlation ID that ties the run to a customer or job
A Postgres table, a BigQuery table, or a managed service like LangSmith all work. The schema matters more than the tool.
Step 2: Define the Three Thresholds You Care About
Pick the three numbers that, if they break, mean a customer is being hurt. For a chatbot, that might be response time, hallucination rate from a sampled review, and unanswered-question rate. For a lead routing flow, that is misrouted leads, missed handoffs, and time-to-first-touch.
Document the threshold for each in plain English: "Alert me if more than 5 percent of runs in a 15-minute window return an unexpected output." The threshold does not need to be perfect. It needs to be actionable.
Step 3: Wire Up Two Alerts to Start
Do not boil the ocean. Wire up two alerts on day one:
- Hard failure alert: Any workflow run that throws an exception or returns an empty result for three consecutive runs in 15 minutes. Pages the on-call owner.
- Soft drift alert: A daily summary of error rates per workflow, sent to the team Slack channel at 9 AM. Reviewed by a human, not paged.
The hard failure alert catches the loud breaks. The soft drift alert catches the slow leaks. Both are mandatory. Most teams add more alerts in weeks two and three once they see what fires.
Step 4: Add a Weekly 30-Minute Review
Once a week, a human reviews the run logs for one workflow. Pick a workflow at random or pick the one that caused the most alerts. Look at 10 to 20 runs in detail. Note anything that looks wrong even if it did not trigger an alert. Add the pattern to your alert thresholds.
This weekly review is the single most valuable observability practice. It catches the failures your alerts missed, and it calibrates your alerts so they stay useful.
AnovaGrowth Operating Insight
When we deploy an AI workflow for a client, we ship it with a run log table and a daily Slack digest on day one. We do not wait until the workflow is "stable." The fastest way to learn what a workflow actually does in production is to look at what it did yesterday.
The mistake we see most often is teams who think monitoring is something you bolt on after the workflow is "done." It is not. Observability is part of the workflow. Every AI agent we build has a logging wrapper that records inputs, outputs, retries, and cost. Every Zapier-style flow we ship has an error-handling step that writes a failure record before it notifies a human.
Two patterns we have learned the hard way:
- Cost alerts beat error alerts. Most teams add error alerts first. Cost alerts catch the slow model drift that lets token usage double without anyone noticing. Set a daily cost threshold per workflow, not just per provider.
- Sample outputs for human review. A weekly sample of 20 random outputs, eyeballed by a human, catches more quality issues than any automated metric. Automate the sampling, keep the review manual.
The combination of structured logs, threshold alerts, cost caps, and a weekly human review is what keeps our clients' AI workflows reliable for months instead of breaking for weeks before someone notices.
Common Fan-Out Questions
Once teams start adding observability, the questions usually go in this order:
- What is the difference between observability and monitoring? Monitoring tracks known failure modes (alert if error rate spikes). Observability lets you ask new questions about a system you did not anticipate (which customers were affected by this drift). AI workflows need both. Logs are observability. Alerts are monitoring.
- How long should I retain run logs? Thirty days is a practical default. Ninety days if you do weekly or monthly trend reviews. Beyond that, store aggregated metrics, not raw runs, to control cost.
- Do I need a separate tool for AI observability, or can I use what I already have? Start with what you have. A Postgres table plus a daily cron plus Slack will catch 80 percent of incidents. Add a specialized tool like LangSmith or Helicone only when the volume or complexity justifies it.
- What should I do when an alert fires but nothing is actually broken? That is fine. False positives are how you calibrate. After three real fires and one false positive, you know whether to tighten or loosen the threshold. Do not silence alerts because they feel noisy. Tune them.
- How do I observe cost without slowing the workflow down? Write a counter row to your log table on every run with token usage and estimated cost. A daily cron reads the table, sums cost per workflow, and posts to Slack. Cost becomes a normal observability signal like any other.
- Should I sample logs or keep every run? Start with every run. Storage is cheap compared to debugging blind. Once you hit 50,000 runs per day per workflow, sample high-volume workflows at 10 percent and keep low-volume ones at 100 percent.
When to Skip Building This Yourself
Observability is one of those things most teams should buy rather than build. Skip a custom stack if any of these apply:
- You are running fewer than 10 AI workflows and your total volume is under 1,000 runs per day. A managed tool like LangSmith, Helicone, or the built-in logs in n8n, Make, or Zapier will cover you.
- You do not have an engineer on staff who can wire up a logging wrapper and a cron. A managed tool gives you the dashboards without the plumbing.
- Your workflows are mostly deterministic and use AI only as a small step. A traditional error tracker is enough.
Build your own observability layer if you are running 50 or more workflows, your AI is customer-facing at scale, or you have strict data residency or privacy requirements that block managed tools.
For most service businesses and small operations, a managed observability tool plus the three thresholds and weekly review described above is enough to keep AI workflows reliable for the long haul.
Ready to ship AI workflows that fail loud, not silent? Talk to AnovaGrowth about adding observability to your existing automations, or read our AI cost management guide to see how cost alerts fit into a complete AI operations stack. If you are still deciding whether to build or buy your observability tooling, our workflow audit guide walks through the full decision process.