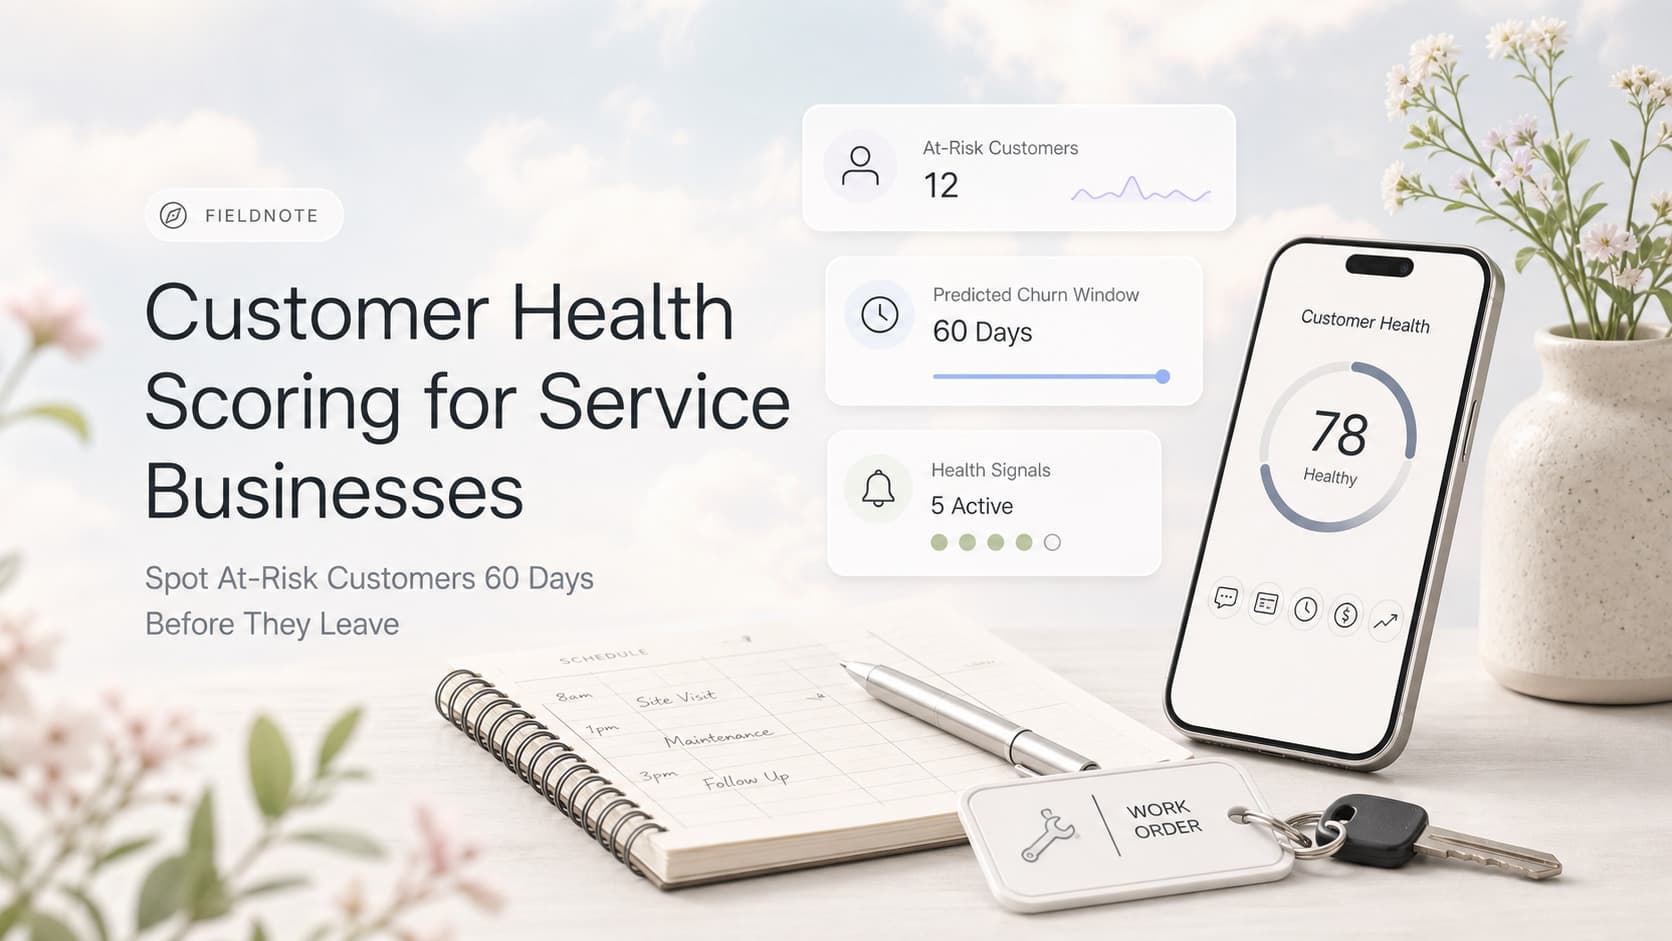
Quick answer: Customer health scoring is a 0-100 number that tells you how likely a customer is to keep using your service business, based on five signals you already collect: tenure, recency of last service, complaint history, payment behavior, and responsiveness. A simple weighted formula turns those signals into a green, yellow, or red flag in your CRM. The save workflow kicks in at yellow. Customer health scoring lets service businesses catch 70-80% of churn risk 60-90 days before the customer leaves, instead of finding out when they never call back.
The Customer You Did Not Know Was Leaving
The phone used to ring every March. The same homeowner. The same HVAC tune-up. For six years. Last spring, the phone did not ring. You assumed they were busy. By the time you checked your CRM, you saw they had booked a one-time service with a competitor in February and had not responded to your last two follow-ups.
You lost a six-year customer. The cost was not just the $189 tune-up. It was the $4,200 in future service revenue, the two referrals they would have sent, and the gap they left in your retention rate that marketing has to spend real money to fill.
Almost every service business loses customers this way. The customer does not get angry. They do not complain. They just stop calling. By the time you notice, the relationship is over.
Customer health scoring is the early warning system. It watches the signals you already have, flags the customers who are slipping, and triggers a save workflow before they are gone.
Why Service Businesses Miss Churn Until It Is Too Late
Three structural reasons keep service businesses blind to churn.
You do not have a single source of contact truth. Most service businesses store customer history in three places: the CRM, the dispatch system, and the accounting platform. None of them talk to each other. The last service date lives in dispatch. The complaint history lives in email. The payment behavior lives in QuickBooks. By the time you tried to manually check whether a customer was at risk, you would have given up.
You sell transactions, not relationships. Service businesses are optimized for the next job. The dispatch board shows today's work. The schedule shows tomorrow's. Nothing on the screen shows the customer who used to call every spring and has not called in 14 months. The system is built to fill today, not to protect next year.
You rely on the customer to come back. Reactive retention is the default. The customer has a problem, they call you, you fix it. The day they stop having problems, or they find a competitor who calls them first, you lose them. Proactive retention requires a system that flags the slip and a workflow that triggers outreach.
Customer health scoring fixes all three. It connects the data, watches the signals, and acts on the slip.
What Customer Health Scoring Actually Is
Customer health scoring is a 0-100 number that rates how likely a customer is to keep doing business with you. It is a number, not a feeling. It is calculated from signals you already collect, weighted by how well each signal predicts churn.
A simple service business health score has five components:
| Signal | What It Captures | Weight |
|---|---|---|
| Recency of last service | How long since the customer last used you | 30% |
| Frequency trend | Are they calling more or less often than they used to | 20% |
| Complaint or service issue history | Did something go wrong that was not resolved | 20% |
| Payment behavior | Do they pay on time, late, or skip payments | 15% |
| Response to outreach | Do they open your emails, answer the phone, or go silent | 15% |
The weights are not magic. They reflect what most service businesses find matters most. Recency and frequency are the heaviest because they are the most predictive of churn. A customer who has not used you in 16 months is more likely to churn than a customer who pays 3 days late.
The output is a single number plus a color tag:
| Score | Color | Meaning | Action |
|---|---|---|---|
| 80-100 | Green | Active, healthy, likely to renew | Standard cadence, no special outreach |
| 50-79 | Yellow | Slipping, possibly at risk | Trigger save workflow within 7 days |
| 0-49 | Red | Likely to churn or already gone | Win-back campaign or write-off |
Every record in your CRM gets a score. Every score updates as new data comes in. A complaint drops a yellow to a red. A new service call pumps a red back to a yellow. The score moves with the relationship.
The Signals That Actually Predict Churn
Not every signal is worth tracking. The five that matter most for service businesses are the ones you already have. The job is to expose them.
1. Recency of Last Service
Recency is the single strongest predictor. A customer who used you 14 months ago is more likely to churn than a customer who used you 2 months ago. Set the recency budget based on your normal service cycle.
For an HVAC company, the natural service cycle is 6-12 months. A customer who has not called in 14 months is 3 months past their expected cycle. They are at risk.
For a cleaning company, the cycle is 1-4 weeks. A customer who has not booked in 8 weeks is at risk.
For a landscaper, the cycle is seasonal. A customer who skipped this season is at risk.
2. Frequency Trend
A customer who used to call every spring and has not called this year is a different signal than a customer who has never called more than once. The trend matters more than the absolute count.
Track the year-over-year change in service frequency. If a customer booked 3 times last year and 0 times this year, the trend is down. If they booked 3 times last year and 4 times this year, the trend is up.
3. Complaint History
A complaint that was resolved is a small hit. An unresolved complaint is a large hit. A repeat complaint is a churn risk.
Tag every complaint in your CRM with the resolution status. Customers with open complaints get a heat penalty that does not clear until the complaint is closed and a follow-up survey is positive.
4. Payment Behavior
Slow payers are not always churn risks. They might just be slow. But customers who stopped paying for ongoing service, or who disputed a charge, are showing a churn signal.
Track the average days to pay, the count of late payments, and the count of chargebacks. A customer with 2+ late payments in the last 12 months is showing financial strain or disengagement.
5. Outreach Response
If you send a maintenance reminder and the customer does not open it, that is a signal. If they do not open two reminders in a row, the signal is stronger. If they do not answer the phone when you call about a quote, they are disengaging.
Email open rates, reply rates, and phone answer rates are all logged in your CRM or marketing platform. Pull them into the health score.
How to Build the Health Score in 90 Days
You do not need a data team. You need a CRM, a spreadsheet, and 90 days of focus.
Step 1: Pick the Five Signals
Start with the five signals above. If your CRM does not capture one of them (for example, payment behavior), start with the four you have and add the fifth later.
Step 2: Assign the Weights
Use the weights from the table above as a starting point. After 90 days of running the model, look at the customers who churned and adjust the weights to match what actually predicted churn for your business.
Step 3: Build the Formula
A simple weighted formula works:
score = (recency_score * 0.30) +
        (frequency_score * 0.20) +
        (complaint_score * 0.20) +
        (payment_score * 0.15) +
        (response_score * 0.15)
Each individual score is also 0-100. For recency, for example, a customer who used you 6 months ago gets 90. A customer who used you 16 months ago gets 20.
Step 4: Backfill the Scores
Run the formula against your existing customer list. You will see customers you thought were healthy sitting in the red zone. This is the moment of truth. Most service businesses discover 15-25% of their customer base is at risk and they did not know.
Step 5: Set Up the Save Workflow
For yellow customers, the workflow is:
- Trigger a save email within 7 days of the yellow flag
- If no response, trigger a phone call within 14 days
- If still no response, drop a handwritten note in the mail within 30 days
- If no response after 60 days, move to win-back campaign
For red customers, the workflow is:
- Trigger a direct call from the owner within 48 hours
- If no answer, send a personal email with a small incentive
- If no response within 30 days, mark as churned and remove from active outreach
Step 6: Refresh the Scores Weekly
The score is only useful if it is fresh. Run the recalculation every week. New service visits update the recency and frequency. New complaints update the complaint score. New payments update the payment score.
What This Looks Like in Practice
A plumbing company in Calhoun, GA had 1,400 active customer records. They had no churn tracking. They did not know which customers were at risk.
We built the five-signal health score using their CRM data. The result on day one:
- 612 customers Green (44%)
- 478 customers Yellow (34%)
- 310 customers Red (22%)
The 310 red customers were the surprise. Half of them had not used the company in 18+ months. The other half had open complaints or unresolved disputes. The owner assumed he had a 1,400-customer business. He actually had a 1,090-customer business with 310 quiet leavers.
We set up the save workflow. Within 90 days:
- 142 of the 478 yellow customers moved back to green (30% save rate)
- 47 of the 310 red customers re-engaged (15% save rate)
- 263 customers were confirmed churned and removed from the active list
The owner recovered $87,000 in expected lifetime revenue from the saves. The cleaned list let him focus ad spend on the 1,137 customers who actually had a chance of converting.
The health score now runs every Sunday night. The save workflow fires every Tuesday morning. The report goes to the owner every Monday. The model has been running for 8 months. Save rate on yellow customers is 32%. Save rate on red customers is 14%.
The Save Workflow That Actually Works
A health score without a save workflow is just a report. The save workflow is where the money comes back.
Email save (yellow zone): Send a personal email from the owner, not a marketing blast. Lead with the customer's history. "It has been 14 months since we last serviced your AC. Hope everything is running well. We had a 30-minute opening next Thursday if you want to get ahead of the summer rush." Short, personal, no discount.
Phone save (yellow zone, no email response): Call from the customer's last tech if possible. The customer remembers the person. "Hi, this is Marcus from Rome Plumbing. We did your water heater last spring. Wondering how it is holding up. We are in your neighborhood next week and could do a quick checkup if you want."
Incentive save (red zone): A small incentive works better than a big discount. "We miss you. $50 off your next service, no expiration." A 75% off coupon trains customers to wait for the coupon. A $50 thank-you trains them to come back.
Owner save (red zone, second contact): The owner calls personally. The customer knows the difference. The owner says thank you, asks what happened, and listens. The conversion rate on owner calls is 5-10x the conversion rate on marketing emails.
Win-back (red zone, post-90 days): If the customer has not responded in 90 days, move them to a quarterly win-back campaign. Most service businesses have 5-15% win-back success on dormant customers. The campaign is worth running because the customer acquisition cost is zero.
Common Mistakes to Avoid
Using too many signals. Start with five. Adding more signals does not improve accuracy. It makes the model harder to maintain and easier to break.
Letting the score drift. The score is a snapshot. If you calculate it once and never update, it is useless. The refresh has to be weekly.
Treating yellow and red the same. Yellow is a save opportunity. Red is a save-or-write-off decision. The volume of outreach is different. The owner should be involved in red, not yellow.
Forgetting the positive signals. The score should reward good behavior, not just penalize bad behavior. A customer who refers a friend gets a small boost. A customer who books online gets a small boost. The score should reflect the full relationship.
Not closing the loop. When a save workflow succeeds, update the score, log the activity in the CRM, and bring the customer back into the standard cadence. The score is a system, not a one-time project.
AnovaGrowth Operating Insight
The health score is not about the customer. It is about the system. The customers who are yellow today are the customers who will be red in 90 days. The customers who are red today are the customers who will be churned in 180 days. The earlier you catch the slip, the cheaper the save. A save email costs $0.10. A save phone call costs $5. An owner save call costs $15. A replacement customer acquired through marketing costs $200-$600. The math is obvious. The discipline is not.
The biggest mistake we see is treating the health score as a one-time dashboard. The teams that get the most value from health scoring run it as a weekly operating rhythm. They review the new yellows on Monday. They make the save calls on Tuesday. They update the scores on Sunday. They report the save rate to the team every month. The score becomes the operating system for retention, not a side project.
In one home services client, the Monday yellow review became the most important meeting of the week. The owner would walk through 15-20 yellow customers, decide who got an email and who got a call, and the team would execute during the week. The save rate went from 8% to 32% in 90 days. The repeat service rate went from 28% to 47% over the next two quarters. The team said the change was not the model. It was the discipline of looking at the list every week.
What This Connects to Your Other Systems
The health score is most powerful when it shares data with the systems around it.
If the score is showing 300 yellow customers and the save workflow is firing, Automated Customer Retention for Service Businesses covers the retention sequences that work alongside the save workflow.
If the yellow customers are mostly maintenance customers who have not booked their next service, Automated Service Agreement Management for Service Businesses shows how to set up automated renewal reminders.
If the score is showing complaints as the biggest hit, Automated Customer Complaint Management for Service Businesses covers the workflow that turns complaints into saves before they become churn.
If the score is flagging frequency decline, Data-Driven Decision Making for Service Businesses covers how to spot the underlying operational pattern behind the slip.
If the CRM data is too messy to score reliably, CRM Data Cleanup Before AI Automation covers the cleanup steps that make the health score trustworthy.
Related Questions and Subtopics
- What is customer health scoring for a service business? It is a 0-100 score built from five signals (recency, frequency, complaints, payment, outreach response) that rates how likely a customer is to keep using your business. The score is calculated weekly, tagged green, yellow, or red, and drives a save workflow that catches churn 60-90 days early.
- What signals predict customer churn for service businesses? The five most predictive are: recency of last service, year-over-year frequency trend, complaint history, payment behavior, and outreach response rate. Recency and frequency are the heaviest weighted because they are the most statistically predictive of churn.
- How often should I refresh customer health scores? Weekly. Daily creates noise. Monthly is too slow to catch the slip. The refresh takes 15-30 minutes for a customer base of 1,000-2,000 records if the CRM is clean.
- What is a good save rate for at-risk customers? Service businesses that run a healthy save workflow recover 25-35% of yellow customers and 10-15% of red customers. Below 15% save rate on yellow means the workflow is too slow or the outreach is too generic.
- How do I handle customers who score red but are still active? A red score is a warning, not a verdict. A customer who just had a service call might have a stale score. The refresh date matters. Always check the score timestamp before triggering the red workflow.
- Can I run customer health scoring without a CRM? Technically yes, in a spreadsheet. Operationally no. The score needs to update automatically as new data arrives. A spreadsheet version requires manual refresh that nobody will keep current.
- What is the difference between customer health scoring and customer segmentation? Segmentation groups customers by static attributes (industry, location, spend tier). Health scoring rates customers by dynamic behavior (recency, frequency, complaint, payment, response). They work together. Segmentation drives what offer to send. Health scoring drives whether to send it.
- How do I get the team to actually use the health score? Tie the score to a weekly meeting. The team has to look at the yellow list every week. The score is not a dashboard. It is a meeting agenda. The meeting is where the saves happen.
Key Takeaways
- Customer health scoring is a 0-100 number that predicts churn 60-90 days before it happens.
- The five signals are recency, frequency, complaints, payment, and outreach response.
- Yellow is a save opportunity. Red is a save-or-write-off decision. The two need different workflows.
- The save workflow is the operating system. The score without a save workflow is just a report.
- Backfill the score on day one to find the quiet leavers you did not know you had.
- Refresh the score weekly. Stale scores are worse than no scores.
- A plumbing client recovered $87,000 in expected lifetime revenue from yellow and red saves in 90 days.
- The owner save call is the highest-converting outreach at 5-10x the conversion rate of marketing emails.
- The health score is most valuable when it is a weekly operating rhythm, not a one-time dashboard.
- Score only what you can act on. Five signals beats fifteen if the five are tracked consistently.
Next Steps
The fastest way to start is to pick the five signals, pull the data from your CRM and dispatch system, and run the scoring formula against your active customer list in a spreadsheet. The backfill will show you the quiet leavers within an hour. From there, set up the weekly refresh and the save workflow for yellow and red customers. Run the cycle for 90 days. Track the save rate. Adjust the weights based on what actually predicted churn in your business.
If you want help building the health score model, wiring the five signals into your CRM and dispatch system, setting up the save workflow, and running the weekly operating rhythm that turns the score into a retention engine, contact us for a 30-minute customer health review. We will audit your CRM data, draft the scoring formula and weights, and outline the automation you need to catch 70-80% of churn 60-90 days before it happens.
Ready to stop losing customers quietly? Contact us and we will build the customer health score, the save workflow, and the weekly operating rhythm that turns your CRM data into a retention engine.