Automated Reporting for Service Businesses: Stop Building Manual Reports, Start Making Decisions
Service businesses spend 8-12 hours per month on manual reports. Automated reporting cuts that to zero and surfaces insights you would miss.

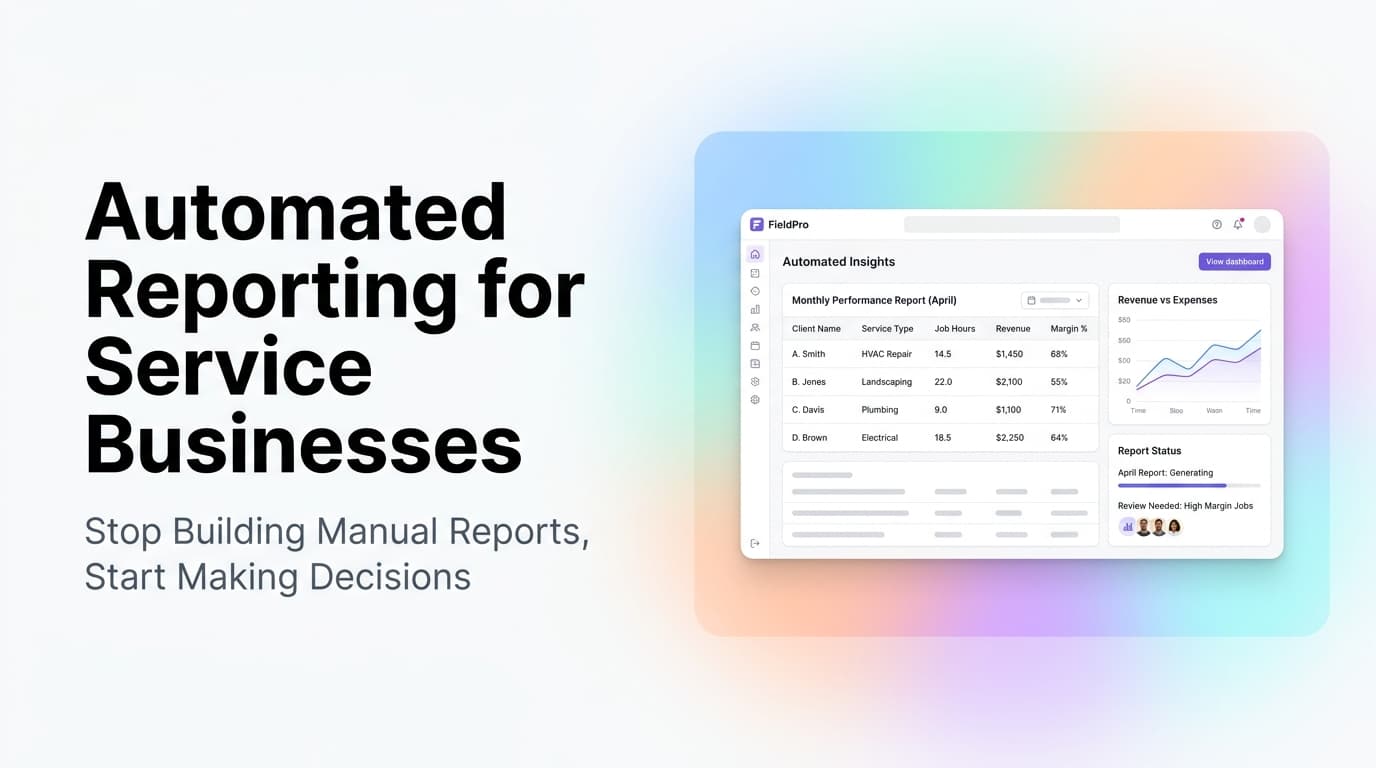
Quick answer: Automated reporting connects your CRM, scheduling, accounting, and job management tools to a single dashboard that updates itself. Instead of spending 8-12 hours per month pulling data from 4-6 systems and building spreadsheets, you get real-time visibility into revenue, job profitability, technician performance, lead conversion, and customer retention. Most service businesses can set this up in 2-3 weeks with existing tools.
The Reporting Problem Nobody Talks About
Every service business owner we talk to has the same story. They know the data they need exists somewhere. Job costs are in the accounting software. Lead sources are in the CRM. Technician hours are in the scheduling tool. Customer history is scattered across email, notes, and old invoices.
The problem is not a lack of data. The problem is that the data lives in 4-6 different places and nobody has time to stitch it together.
So what happens? The owner or office manager spends a full day each month pulling reports from each system, copying numbers into a spreadsheet, and trying to make sense of it all. By the time the report is done, the data is already 2-3 weeks old. Decisions get made on stale information.
What this costs in real terms:
| Problem | Impact |
|---|---|
| Manual reporting time | 8-12 hours per month of admin or owner time |
| Stale data | Decisions made on 2-3 week old information |
| Missed patterns | Can't spot declining margins until it's too late |
| No drill-down | See revenue is down but can't tell which service line |
| Blame vs. fix | Arguments based on gut feel instead of data |
What Automated Reporting Actually Looks Like
Automated reporting is not a fancy dashboard that shows you pretty charts you never look at. It is a system that pulls data from every tool you use, normalizes it, and presents it in a way that answers specific business questions.
The core components:
- Data connectors that pull from your CRM, accounting software, scheduling platform, and payment processor
- A central data store that maps fields from each system to a common schema
- Pre-built report templates for the metrics that matter most to service businesses
- Automated delivery via email, Slack, or a shared dashboard on a schedule you set
What you can stop doing:
- Exporting CSVs from your CRM every Monday morning
- Copying and pasting numbers into Excel
- Reconciling job costs against invoices by hand
- Building the same monthly report from scratch every single time
The 5 Reports Every Service Business Should Automate First
Not all reports are worth automating. These five deliver the fastest return because they answer the questions owners ask most often.
1. Job Profitability Report
This is the single most important report for any service business. It answers one question: which jobs actually made money?
Most service businesses track revenue but not job-level profit. A job might look profitable on the invoice but lose money once you factor in travel time, materials, and rework. An automated job profitability report pulls cost data from your accounting system, time data from your scheduling tool, and revenue data from your CRM to calculate true margin per job.
What to include: Job number, customer name, service type, total revenue, total cost (labor + materials + travel), gross margin percentage, and a flag for jobs under target margin.
2. Lead Source Performance
You probably know where your leads come from. But do you know which sources produce the highest-value jobs, not just the most leads?
An automated lead source report connects your CRM's lead tracking to your accounting system's job value data. It shows you cost per lead, conversion rate, average job value, and total ROI by source. This is the report that tells you whether Google Ads, referrals, or your website is actually driving profitable work.
3. Technician Performance
If you have field technicians, you need to know who is efficient and who is not. But efficiency is not just about how many jobs they complete.
An automated technician report shows jobs completed, average time per job, customer satisfaction scores, upsell rate, and rework rate. It normalizes for job complexity so you are comparing apples to apples. This report helps you identify who needs training, who deserves a raise, and who is costing you money.
4. Customer Retention and Lifetime Value
Service businesses lose 20-40% of customers every year to churn. An automated retention report tracks when each customer was last serviced, how many jobs they have booked, their average spend per year, and their churn risk score.
The real value is in the alerts. When a customer who used to book quarterly maintenance has not called in 6 months, the system flags them for re-engagement. You catch the leak before the customer is gone.
5. Cash Flow Forecast
Cash flow is the #1 reason service businesses fail. An automated cash flow forecast pulls scheduled jobs, outstanding invoices, and recurring revenue to project your cash position 30, 60, and 90 days out.
This report answers the question every owner asks: "Can I afford to hire another technician next month?" It also flags slow-paying customers before their balance becomes a problem.
How to Set This Up Without a Data Team
You do not need a data engineer or a six-figure software investment to automate your reporting. Here is the practical path.
Step 1: Audit your tools. List every system you use to run your business. CRM, scheduling, accounting, payment processing, email marketing. Write down what data each one holds and where the gaps are.
Step 2: Pick a central platform. Most service businesses already have a CRM or ERP that can serve as the hub. If yours has a decent API and reporting module, start there. If not, tools like Power BI, Tableau, or even Google Data Studio can connect to multiple sources.
Step 3: Map your key fields. Identify the fields that matter for each report. Job ID, customer name, revenue, cost, date, service type, technician. Make sure each system uses consistent naming or set up a mapping layer.
Step 4: Build connectors. Use native integrations, Zapier, Make, or a custom API integration to pull data from each system into your central platform. This is where most projects stall, but it is also where the value lives.
Step 5: Create report templates. Build each report once. Set up automated delivery on a schedule. Monday morning email for the weekly snapshot. First of the month for the deep dive.
Step 6: Iterate. No reporting system is perfect on day one. Use it for 30 days, note what is missing, and adjust.
What We Have Learned Building Reporting Systems for Service Businesses
We have built automated reporting systems for HVAC companies, plumbing contractors, cleaning services, and field service operations. Here is what we have found.
The biggest mistake is trying to automate everything at once. Start with one report. The job profitability report is usually the best first choice because it has the highest financial impact and the data is usually already available in your accounting system.
The second biggest mistake is building reports nobody looks at. If the owner does not check the dashboard, it does not matter how good the data is. Set up email delivery with a summary and a link to the full report. Make it impossible to ignore.
The third mistake is perfect data. You do not need 100% accurate data to make better decisions. 80% accuracy with weekly reports beats 100% accuracy with monthly reports every time. Start with what you have and clean it up as you go.
A real example: One HVAC company we worked with was losing money on 30% of their maintenance calls. They had no idea because they only looked at total revenue. After we set up automated job profitability reporting, they discovered that calls over 45 minutes from the shop were consistently unprofitable. They adjusted their pricing by zone and added a travel fee. Margins improved by 8 points in 90 days. That insight was invisible in their old manual reports.
When to Build vs. When to Buy
| Approach | Best For | Cost Range | Timeline |
|---|---|---|---|
| Native CRM reports | Simple needs, single system | Included in CRM subscription | Hours |
| Google Data Studio / Power BI | Multiple data sources, DIY | Free to $20/user/month | 1-2 weeks |
| Zapier/Make + spreadsheet | Quick fix, low budget | $30-100/month | Days |
| Custom integration | Complex needs, many systems | $3,000-10,000 setup | 2-4 weeks |
| Managed reporting service | No internal time or skills | $500-2,000/month | 1-2 weeks |
Related Questions Business Owners Ask
- How do I connect my QuickBooks data to my CRM for automated reporting?
- What is the best KPI dashboard tool for a small service business?
- How often should I review automated reports to catch problems early?
- Can automated reporting replace my monthly accountant review?
- What metrics should a plumbing or HVAC company track weekly vs. monthly?
- How do I set up automated report delivery to my team without manual work?
The Bottom Line
Manual reporting is a tax on your time that you do not need to pay. The tools exist, the integrations are available, and the setup cost is lower than most owners expect. The question is not whether you can afford automated reporting. The question is whether you can afford to keep making decisions on stale data.
Start with one report. Automate it. Look at it every week. Then add the next one. Six months from now, you will wonder how you ever ran the business without it.
Ready to stop building reports by hand? Contact us to talk about setting up automated reporting for your service business. We can usually have your first report running within two weeks.
Related reading: Business KPI Dashboard for Service Businesses and Automated Job Costing for Service Businesses
Related articles
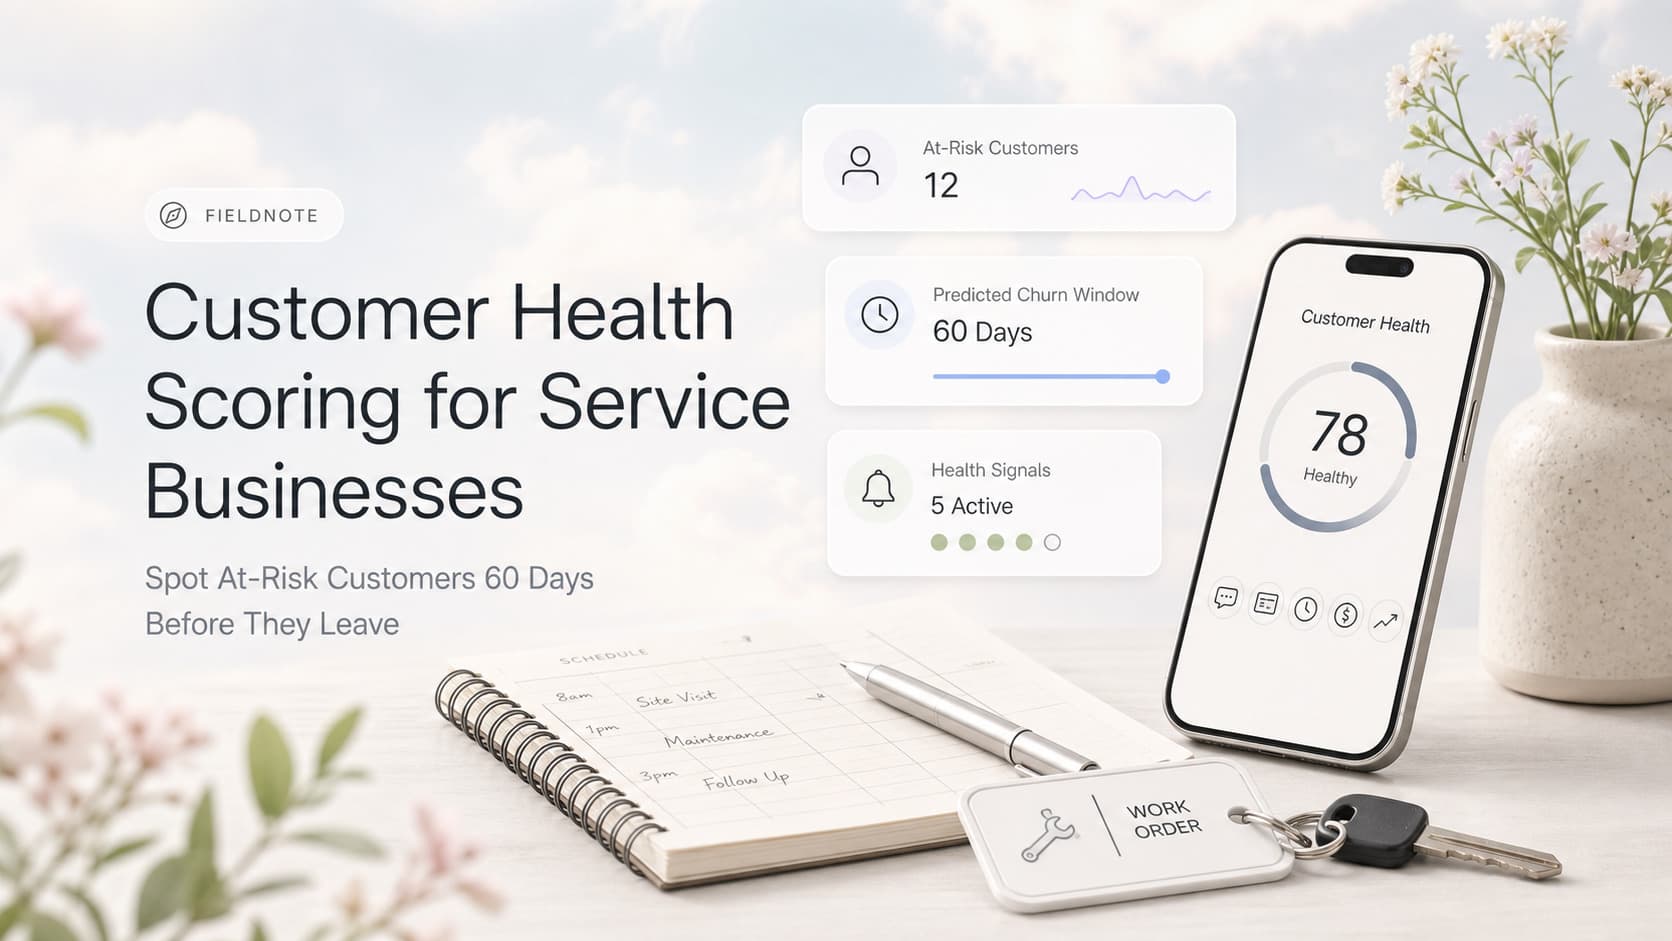
Customer Health Scoring for Service Businesses: Spot At-Risk Customers 60 Days Before They Leave
Service businesses that score customer health on five signals catch 70-80% of churn 60-90 days before it happens. Here is the model, the math, and the workflow.
Read the article: Customer Health Scoring for Service Businesses: Spot At-Risk Customers 60 Days Before They Leave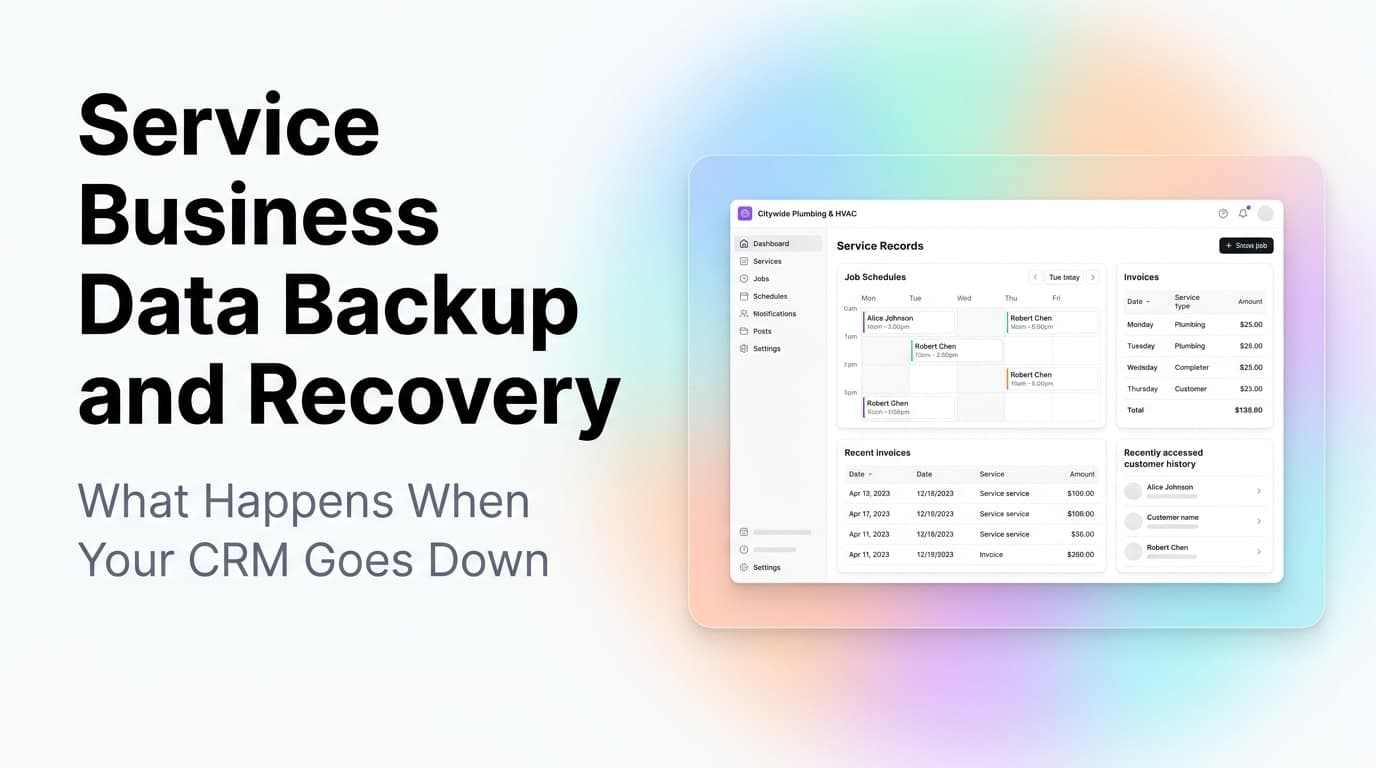
Service Business Data Backup and Recovery: What Happens When Your CRM Goes Down
When your CRM goes down, you lose access to customer history, job schedules, and invoices. Here is how service businesses protect their data and recover fast.
Read the article: Service Business Data Backup and Recovery: What Happens When Your CRM Goes Down
CRM Dashboard Metrics That Matter for Service Businesses
Most service businesses track the wrong CRM metrics. Here is what to measure instead to know which jobs are profitable and which leads convert.
Read the article: CRM Dashboard Metrics That Matter for Service Businesses
