Quick Answer
Customer lifetime value (CLV) is the total gross profit a service business earns from one customer across the entire relationship, not just the first invoice. For service businesses it is the single most useful number for setting acquisition budgets, choosing who to re-engage, and deciding where to automate retention. Most operators under-count CLV because they stop measuring after the first job. The 2026 playbook is simple: calculate it, segment it, then run automation against the segments that move the needle.
Why Most Service Businesses Run Blind on Acquisition
The owner of a 14-person HVAC company in Northwest Georgia told us last quarter that his marketing budget was "about $8,000 a month, mostly Google Ads." When we asked what his average customer was worth over five years, he shrugged. When we asked what his cost to acquire a customer was, he said "somewhere between $200 and $400, I think." When we asked which 20 percent of his customers drove 60 percent of his revenue over the relationship, he had no idea.
This is the norm, not the exception. The vast majority of service businesses run marketing budgets, sales pipelines, and retention programs without ever measuring the one number that ties them all together: customer lifetime value. They optimize the first invoice instead of the relationship. They chase new leads while old customers slip away. They treat repeat business as a happy accident instead of a system.
The fix is not complicated. CLV is a calculation, a segmentation, and a set of automation triggers. We have walked service businesses through this process across plumbing, HVAC, dental, property management, landscaping, and professional services. The lift is consistent. Companies that adopt CLV-driven operations typically grow repeat revenue 20 to 40 percent within 12 months without spending an extra dollar on acquisition.
This playbook is the version we use. It works for any service business with a CRM, a list of past customers, and a willingness to measure what is actually happening.
What Customer Lifetime Value Actually Means
Customer lifetime value is the total gross profit a customer generates over the entire span of their relationship with your business. For a service business, the relationship can be short (a one-time junk removal) or long (a 20-year HVAC service agreement). The point is to stop looking at the first transaction in isolation and start looking at the full arc.
There are three flavors of CLV that get confused in practice:
| CLV Flavor | What It Measures | When To Use It |
|---|---|---|
| Historic CLV | Total gross profit from a customer so far | Segmenting your existing book, ranking customers by past value |
| Predictive CLV | Forecast of total gross profit over the full expected relationship | Acquisition budgeting, lead scoring, retention prioritization |
| Cohort CLV | Gross profit per customer averaged across a group who started in the same period | Tracking whether your business is getting better or worse over time |
For a service business that already has a few years of customer history, all three matter. Historic CLV tells you who your best customers have been. Predictive CLV tells you how much to pay to win the next one. Cohort CLV tells you whether your operations are improving or rotting.
A common mistake is to call "average ticket size" lifetime value. It is not. A $400 first ticket means nothing if the customer never calls back. A $900 first ticket with two service calls a year for six years is worth roughly $11,000 in revenue and several thousand in profit. Same customer, very different value to your business.
The CLV Formula Service Businesses Should Use
There are academic CLV formulas with discount rates and churn probabilities. They are correct, and they are useless for a 10-person service business that just needs a number to make decisions. Here is the practical version:
Historic CLV = Average Gross Profit per Job x Average Jobs per Customer per Year x Average Customer Lifespan (years)
You can stop there for most decisions. Three inputs, all of which you can pull from your CRM or accounting system. The three inputs:
- Average gross profit per job. Take your total revenue last year, subtract your direct cost of goods and direct labor, and divide by jobs completed. If you do not track gross profit per job, use revenue per job and label it "revenue CLV" instead. It is less precise but still useful.
- Average jobs per customer per year. Total completed jobs divided by the count of unique customers. For service businesses with a mix of one-off and recurring work, this is usually between 1.1 and 2.5.
- Average customer lifespan in years. The simplest version: how long does the average customer keep coming back before they churn or go silent? For most service businesses this is 3 to 7 years. For property managers and HVAC service agreement customers, it can be 10+.
A worked example for a residential HVAC company:
- Average gross profit per job: $280
- Average jobs per customer per year: 1.6
- Average customer lifespan: 5 years
Historic CLV = $280 x 1.6 x 5 = $2,240 per customer.
That is the average. Some customers will be worth 10x that. Some will be one-and-done $280 jobs. The point of segmentation is to figure out which is which.
A worked example for a dental practice:
- Average gross profit per patient per year: $450
- Average patient lifespan: 8 years
- Annual services per patient: 2.1
Historic CLV = $450 x 2.1 x 8 = $7,560 per patient.
Same formula, different industry, very different number. The math is not the hard part. The hard part is acting on it.
Segmenting Customers by CLV
Once you can calculate CLV, the next move is to sort your customer base into segments. The segments most service businesses find useful:
| Segment | What Defines It | What To Do With It |
|---|---|---|
| Champions | Top 10% by CLV, repeat buyers, long tenure | Protect. Surprise them. Ask for referrals. Never let them lapse. |
| Loyalists | Repeat buyers, mid-tier CLV, 2+ years tenure | Nurture. Move them up the value ladder with maintenance plans and upgrades. |
| New high-value | Recent first purchase, high predicted CLV | Onboard well. Set the second appointment before they leave the first job. |
| One-and-done | Single purchase, no repeat, low tenure | Decide: reactivate or release. Most are worth a low-cost re-engagement sequence. |
| Dormant | Past customer, no activity in 12+ months | Run a win-back campaign. Cost of reactivation is usually 5x cheaper than new acquisition. |
| Loss leader | High-touch, low-margin, frequent complaints | Refuse or reprice. CLV can be negative when service costs eat the margin. |
This is the segmentation that changes behavior. Instead of treating every customer the same, the service team knows who to call first, who to send the premium offer to, who gets the discount, and who gets politely released.
In practice, the segmentation lives in your CRM. A few custom fields, a smart list per segment, and a recurring automation that updates each contact as their behavior changes. We use HubSpot and Pipedrive for most clients. Both handle this with native workflows.
How CLV Changes Your Acquisition Budget
This is where CLV pays for itself fastest. Once you know what a customer is worth, you can set a customer acquisition cost (CAC) target without guessing.
The rule of thumb is straightforward: target CAC at 20 to 30 percent of first-year gross profit per customer, and let lifetime gross profit carry the rest. For the HVAC example above, that means a CAC target of $56 to $84 per new customer, not the $200 to $400 the owner was guessing at.
That single change unlocks several decisions:
- Google Ads bid caps. If your target CAC is $80, you can run conversion-based bidding with a target cost-per-acquisition that the platform can actually hit. The wider the target CAC, the more the platform will burn.
- Lead form qualification. When every lead is worth $2,240 instead of $280, you can afford a 10-minute qualification call before dispatching a tech. You cannot afford to send a tech to every form fill.
- Referral program economics. A referral that costs you a $100 thank-you to the referrer and saves you $80 in CAC has a positive ROI in the first month and a much bigger ROI in year two when the referred customer repeats.
- Sales follow-up intensity. When a lead is worth $2,240 over five years, a 14-touch follow-up sequence pays for itself. When it is worth $280, a 14-touch sequence is a waste of time.
Most service businesses overspend on acquisition and underspend on retention for the simple reason that acquisition has a visible cost line and retention does not. CLV makes the trade-off visible.
How To Increase CLV With Retention
Retention is the highest-ROI lever for CLV. The math is asymmetric: a 5 percent increase in customer retention typically produces 25 to 95 percent more profit, depending on the industry. Bain and Co. published the original finding in the 1990s. The numbers still hold.
For service businesses, retention breaks into six moves that compound:
- Maintenance and service agreements. The single most reliable CLV driver in service businesses. HVAC tune-ups, plumbing inspections, dental cleanings, property management contracts, lawn care visits. Each one resets the relationship clock and creates another touchpoint to sell more work.
- Second appointment before the first job ends. Techs finish a job, hand the customer a card with a 12-month follow-up already booked, and the customer leaves with a reason to come back. This one move has lifted repeat rate 15 to 30 percent in our engagements.
- Annual check-in. A 90-second phone call or text 11 months after the last job. "Hey, your system is due for its annual service. Want me to book it for the same week?" Most customers say yes.
- Seasonal reminders. Spring AC tune-up, fall furnace check, gutter cleaning before the leaves fall. Calendar-driven, automated, and almost free to send.
- Reactivation sequences. Anyone who has not interacted in 12+ months goes into a 3-step reactivation flow: a friendly text, an email with a small offer, a final voicemail. The offer is usually 10 to 15 percent off the next service.
- Complaint recovery. Service businesses that respond to complaints within an hour and resolve them same-day retain the customer at roughly twice the rate of businesses that respond the next day. Speed matters more than perfection.
Each of these is automatable. We have set up maintenance agreement reminders, second-appointment booking, annual check-ins, seasonal campaigns, reactivation flows, and complaint routing for clients in HubSpot, Jobber, Housecall Pro, and ServiceTitan. The pattern is the same: the trigger fires, the right message goes out, the CRM updates, the team sees it.
For a deeper dive on retention automation, see our automated customer retention guide. For service agreements specifically, the recurring revenue playbook walks through how to design, price, and roll out a maintenance plan.
How To Increase CLV With Upsell and Cross-Sell
Retention keeps the customer. Upsell and cross-sell raise the value of every interaction. For service businesses, this is usually simpler than e-commerce:
- HVAC tech finishes a repair. Suggest the upgraded filter, the smart thermostat, or the maintenance plan that covers both. Tech commissions the upgrade. CRM logs it.
- Plumber replaces a water heater. Offer the expansion tank, the leak sensor, and the annual flush plan at the same time. Most customers say yes when they are already paying for the visit.
- Dental hygienist finishes a cleaning. Flags a watch tooth for the dentist, schedules a follow-up visit before the patient leaves. Hygiene is the upsell engine.
- Property manager handles a tenant move-out. Pitches the turnkey cleaning package, the carpet cleaning add-on, and the pest control inspection to the owner. Owner says yes because they were already paying for the turnover.
The key is timing. The upsell that lands is the one offered when the customer is already paying you for a related service and the value is obvious. The upsell that fails is the cold email three months later asking them to buy something new.
For the full mechanics of upsell and cross-sell programs in service businesses, the automated upsell and cross-sell playbook walks through the offer design, the trigger setup, and the reporting.
How To Measure CLV With the CRM You Already Have
You do not need new software. Every modern CRM can calculate CLV with three custom fields, a couple of saved reports, and one workflow.
Here is the minimum viable setup:
Three custom fields on the contact record:
First job date(date)Total gross profit(currency, rolled up from invoice line items)CLV segment(dropdown: Champion, Loyalist, New high-value, One-and-done, Dormant, Loss leader)
One workflow that runs weekly:
- For every contact with at least one closed deal in the last 24 months, calculate the field values and assign the CLV segment based on the rules above.
Three saved reports:
- CLV by source (to see which marketing channels produce the highest-value customers)
- CLV trend over time (cohort view, to see whether your business is getting better)
- CLV segment counts (to track how many champions, loyalists, and dormant contacts you have)
That is enough to start making decisions. Everything else is polish.
If your CRM does not support these custom fields and workflows, it is probably time to migrate. The CRM migration playbook covers the project plan, the data cleanup, and the cutover for service businesses.
For the underlying automation that updates these fields without anyone touching them, the CRM integration guide walks through the architecture we use for most clients.
A First-Hand Look at CLV in Action
A plumbing client we onboarded last year had 9,400 contacts in their CRM and no idea what any of them were worth. The owner was spending roughly $6,500 a month on Google Ads and another $1,800 on Facebook, getting about 35 new leads per month, closing 22 of them, and assuming each new customer was worth the average ticket of $340.
We ran the CLV calculation across the existing book and found three things:
- Customers acquired through Google Ads had a 12-month repeat rate of 11 percent and a five-year CLV of roughly $620.
- Customers acquired through referrals had a 12-month repeat rate of 38 percent and a five-year CLV of roughly $2,400.
- Customers acquired through Facebook had a 12-month repeat rate of 4 percent and a five-year CLV of roughly $190.
The Facebook channel looked productive on lead volume and looked terrible on CLV. The owner was paying $80 to $110 per Facebook lead and getting customers that almost never came back. Google Ads looked expensive but produced customers worth 3x the Facebook ones. Referrals looked free on paper and produced customers worth almost 4x the Google ones.
The reallocation was obvious. Cut Facebook by 80 percent. Double Google Ads budget on the highest-converting campaigns. Build a referral program that converts happy customers into a structured acquisition channel. Set up maintenance agreements that move the 11 percent Google repeat rate up toward the 30 percent range.
Twelve months later, total revenue was up 34 percent, ad spend was down 18 percent, and the CLV of customers acquired that year was 41 percent higher than the year before. None of that required new software. It required a CLV calculation, a segmentation, and the discipline to act on it.
For more on how acquisition cost and CLV interact, the marketing ROI without dashboard noise and the lead generation conversion fixes posts go deeper on the underlying mechanics.
The CLV Operating Cadence
CLV is not a one-time calculation. It is an operating cadence. The companies that win on CLV run a four-step loop every quarter:
- Recalculate historic CLV with the latest job and gross profit data.
- Re-segment the book into champions, loyalists, new high-value, one-and-done, dormant, and loss leaders.
- Run targeted automation against each segment. Champions get referral asks. Loyalists get maintenance plans. New high-value customers get second appointments. Dormant customers get reactivation. Loss leaders get released or repriced.
- Review cohort trends. Is the 2026 cohort producing better or worse CLV than the 2025 cohort? If worse, fix the operations, not the marketing.
We set this cadence up in HubSpot or Pipedrive for every client that runs a CLV program. The work takes a day to build and an hour per quarter to maintain. The return compounds every quarter.
For the workflow patterns that run the cadence, see the service business operations audit and the quote-to-cash automation posts for adjacent plays.
Decision Table: Where To Start With CLV
| Starting Point | First Move | Time To First Insight |
|---|---|---|
| You have a CRM and at least 12 months of customer history | Add the three custom fields, run the workflow, segment the book | 1 week |
| You have a CRM but less than 12 months of history | Set up the fields and the segmentation rules now. Let the data accumulate. Run the first cohort report at month 12. | 12 months |
| You do not have a CRM | Pick one (HubSpot for service businesses is the default we recommend). Migrate contacts, set up the fields, start clean. | 4 to 6 weeks |
| You have a CRM but it is a mess | Clean the data first, then layer CLV on top. The CRM cleanup guide covers the project plan. | 2 to 4 weeks |
| You already measure CLV but your team ignores it | Translate CLV into CAC targets, segment-level automation, and quarterly reviews. Make it part of how decisions get made. | 1 quarter |
The right starting point is the one you can finish. CLV is a number that becomes powerful when the team uses it to make decisions, not when it sits in a dashboard.
How AnovaGrowth Builds CLV Programs
A CLV program touches the CRM, the accounting system, the marketing stack, the sales process, and the customer service workflow. Most rollouts stall at the integration layer: getting the right number from the right system into the right field, then running automation against it. That is the part we handle.
We have built CLV programs for plumbing, HVAC, dental, property management, landscaping, and professional services firms. The pattern is the same: calculate, segment, automate, review. The work is not hard. The sequencing is. For a 5 to 50 person service business, the full rollout takes 4 to 6 weeks and produces a measurable lift in repeat revenue within the first quarter.
If you are running a service business without a CLV program, the fastest way to get started is a 30-minute call. We will look at your CRM, your customer base, and your marketing spend, and tell you what your average CLV probably is, what your CAC ceiling should be, and what the first 90 days of work look like. No sales pitch. No pressure.
Ready to grow repeat revenue without raising ad spend? Contact us to map your CLV program.
Frequently Asked Questions
What is customer lifetime value in simple terms?
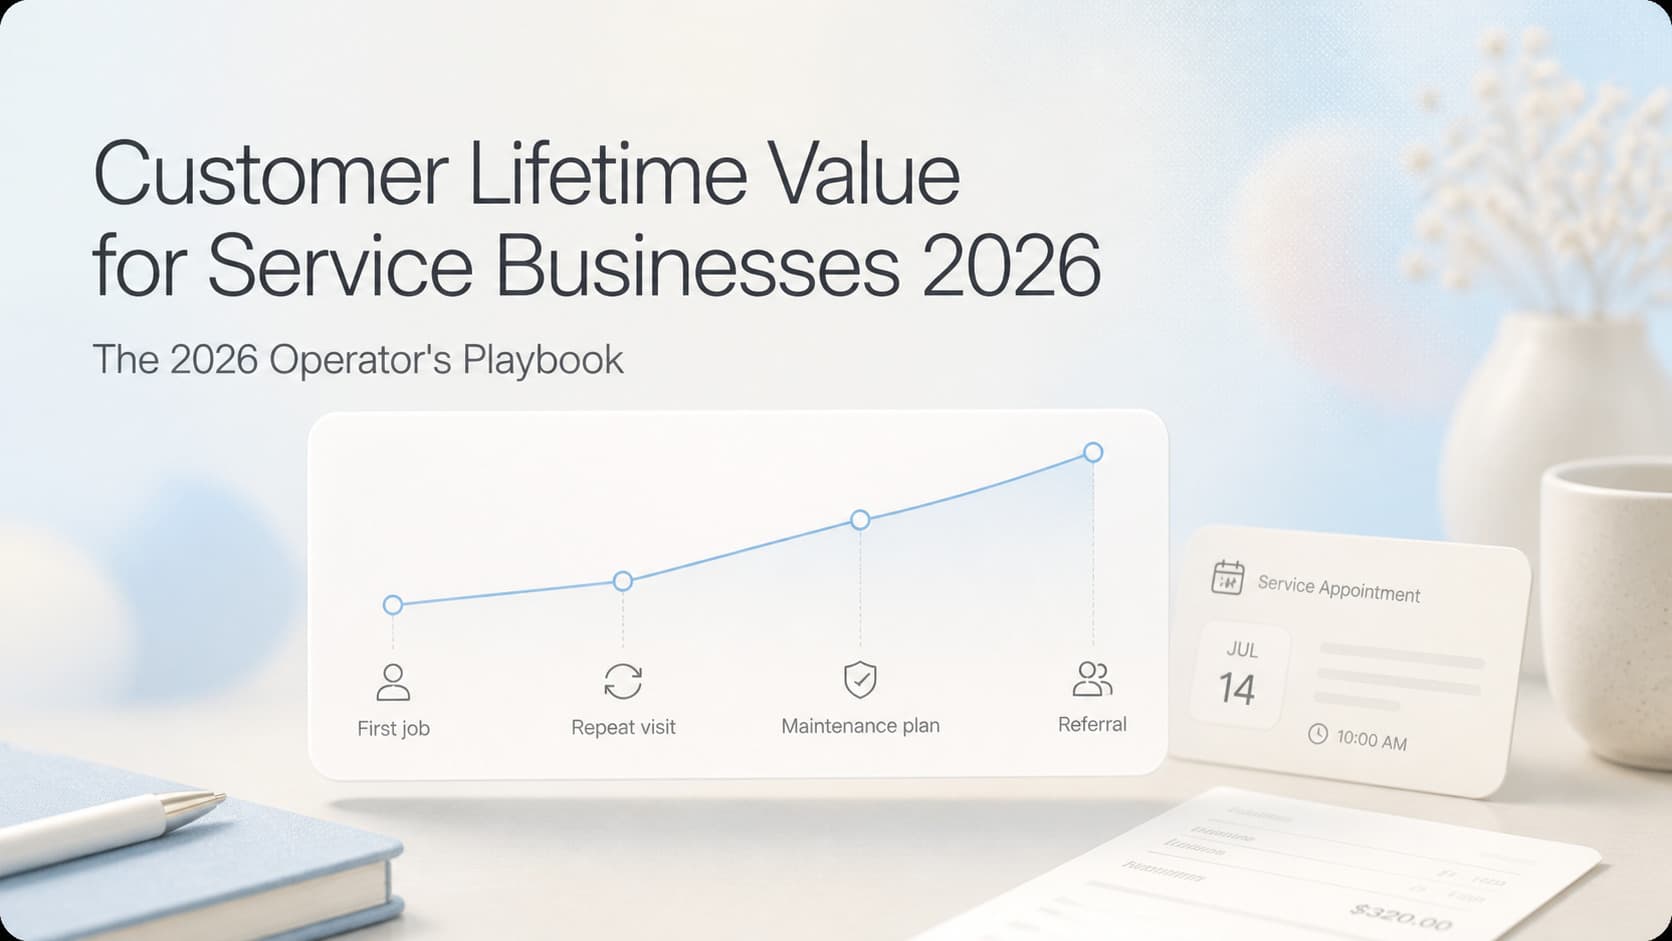
Customer lifetime value is the total gross profit a customer generates over the entire span of their relationship with your business. It is not the first invoice. It is the full arc: first job, repeat visits, upgrades, referrals.
How do I calculate CLV if I do not track gross profit per job?
Use revenue per job instead and label it "revenue CLV." It is less precise than gross profit CLV, but it is still far more useful than looking at first-ticket revenue alone. You can refine it once your accounting is clean.
What is a good CLV for a service business?
It depends on the industry and the average ticket, but a rough rule: CLV should be at least 4x your average first-ticket revenue and ideally 8x or more. Anything below 3x usually means retention is broken.
What is a healthy ratio of customer acquisition cost to CLV?
For service businesses, target a CAC of 20 to 30 percent of first-year gross profit per customer. The lifetime gross profit carries the rest. If your CAC is over 40 percent of first-year gross profit, the channel is structurally unprofitable.
How often should I recalculate CLV?
Quarterly is the right cadence for most service businesses. Monthly is overkill. Annually is too slow. Cohort CLV trends over four quarters tell you whether your business is getting better or worse.
Does CLV work for one-time service businesses like junk removal or move-out cleaning?
Yes, but the lifespan input collapses to one job. CLV becomes a way to compare repeat-purchase potential across customer segments and to decide which leads are worth paying for. It is also useful for spotting the rare repeat customer (a property manager who books move-outs for every unit they manage).
Can I calculate CLV in Excel or Google Sheets?
Yes. Pull a list of customers with first-purchase date, total jobs, and total revenue from your CRM, drop them into a spreadsheet, and apply the formula. It is faster than configuring custom fields if you just want to see the numbers.
What is the difference between CLV and LTV?
None. CLV and LTV are the same metric. CLV stands for customer lifetime value. LTV stands for lifetime value. The terms are used interchangeably across marketing, finance, and product teams.
Do I need a data team to run a CLV program?
No. A service business with a CRM and basic spreadsheet skills can run the calculation, the segmentation, and the automation in-house. The math is three inputs and one multiplication. The hard part is acting on the result, not producing it.
What is the fastest win from CLV?
Reactivation of dormant customers. The cost of re-engaging a past customer is usually 5x cheaper than acquiring a new one, and the resulting revenue shows up within 30 days. It is the lowest-effort, highest-return CLV play for most service businesses.