Service Business Weekly Operations Meeting: The 30-Minute Cadence That Keeps a Small Service Company on Track
A 30-minute weekly ops meeting turns scattered owner reactions into one predictable cadence. Most service companies under 50 people can run it themselves.


Quick answer: A service business weekly operations meeting is a 30-minute standing meeting held the same day and time every week, run from a written agenda, anchored to a one-page scorecard, and attended by the owner plus the two to five people who actually run the field, the office, and the money. The cadence gives a small service company a weekly read on revenue, pipeline, cash, crew, and customer experience, surfaces problems while they are still small, and produces a written list of decisions and owners before the room stands up. Most service companies under 50 people can install the meeting inside a week and recover the cost of the first month inside the first two months.
Why Most Service Companies Run Blind Between Months
The owner of a 22-person HVAC company in the Southeast called us last spring. He had not looked at his P and L in 90 days. He could tell me what the trucks were doing that day. He could not tell me what last month had actually been. When he finally pulled the numbers, two service lines were losing money, the crew was over-utilized on low-margin work, and the sales pipeline had been quietly shrinking for 60 days because nobody was following up on estimates.
None of that was a technology problem. None of it was a people problem. It was a cadence problem. The owner was running the business by walking around the shop and reacting to the loudest thing on his desk. The information he needed to steer existed. He just did not see it on a predictable schedule.
This is the most common operating gap we find inside small service companies. The owner has the data. The owner has the team. The owner does not have a fixed cadence that turns data into a decision on a known day, every week, before small problems become expensive ones.
The fix is older than EOS, older than the Traction book, and older than every operations framework that has come through the service trades in the last 20 years. It is a 30-minute weekly operations meeting, run from a written agenda, anchored to a one-page scorecard, attended by the same four to seven people, with a written list of decisions before the room stands up.
Done right, the meeting pays for itself inside the first month. Done wrong, it becomes a complaint circle that everyone dreads. The difference is the format. The rest of this post walks through the exact format we install inside service companies, the agenda we ship, the scorecard we use, and the rollout sequence that gets the team on the cadence in two weeks.
What a Service Business Weekly Operations Meeting Actually Is
It is a standing meeting, not a status meeting. The same day, the same time, the same room, the same agenda, the same attendees. There is a written agenda. There is a written scorecard. There is a written list of decisions. If the meeting ends without a written list of decisions, the meeting did not happen.
Three rules separate a real operating cadence from a meeting that everyone tolerates:
- The owner runs it. Not the office manager, not the sales lead, not the dispatcher. The owner chairs the meeting, walks the scorecard in order, and asks the questions. If the owner is not in the room, cancel the meeting. Do not delegate the cadence.
- It ends with decisions, not discussion. Every number that is off-trajectory gets a decision before the room moves on. Owner, due date, action. If there is no owner, the owner of the company owns it. If there is no due date, the decision does not exist.
- The scorecard is one page. Not 14 tabs. Not a dashboard nobody reads. One page, seven to nine numbers, color-coded red yellow green, in the same order every week. Anyone in the room should be able to look at the page and tell you whether the week was good or bad inside 30 seconds.
The cost is one hour per week, divided across four to seven people. The payback is the difference between a company that surfaces problems while they are still small and a company that surfaces problems when they are already expensive.
The One-Page Scorecard That Drives the Meeting
The scorecard is the spine. Every weekly meeting walks the same scorecard in the same order. If a number is not on the scorecard, it does not get time in the meeting. If a number is on the scorecard, the owner asks the same question every week: are we on plan, off plan, or trending off plan, and what are we doing about it?
For service businesses in the $2M to $40M revenue range, the scorecard has nine numbers in three groups. The numbers below are the ones we install most often. Owners can swap any number for a more relevant metric, but the structure stays the same.
Section 1: Revenue and Pipeline
These four numbers tell you whether the next 60 to 90 days are healthy.
| Metric | What It Tells You | Source | Cadence |
|---|---|---|---|
| Inbound leads (last 7 days) | Whether marketing is producing enough top-of-funnel demand | CRM or phone system | Weekly |
| Estimate value sent (last 7 days) | Whether quotes are going out the door at the right pace | Estimating platform or CRM | Weekly |
| Estimate-to-close rate (rolling 30 days) | Whether the sales process is converting at the right rate | CRM | Weekly |
| Weighted pipeline (next 60 days) | Whether the booked and probable work covers next month | CRM forecast view | Weekly |
The owner asks four questions every week in this order:
- Did we hit our lead target?
- Did we hit our estimate value target?
- What is our rolling close rate, and is it trending up, flat, or down?
- What is our weighted pipeline for the next 60 days, and what is our coverage ratio against the revenue target?
If any answer is red, the room decides the action before moving on. Owner, due date, written down.
Section 2: Operations and Crew
These three numbers tell you whether the work is being delivered at the margin the company quoted.
| Metric | What It Tells You | Source | Cadence |
|---|---|---|---|
| Jobs completed vs jobs scheduled (last 7 days) | Whether the field is delivering on the schedule | Field service software | Weekly |
| Average job margin (rolling 30 days) | Whether the work being done is profitable | Job costing or accounting | Weekly |
| Crew utilization (last 7 days) | Whether the techs are on the clock productively | Timekeeping plus schedule | Weekly |
The questions here are the ones that catch problems before they hit the P and L. Missed scheduled jobs this week, off how much, why. Job margin trending below target, on which service line. Crew utilization below 70 percent or above 90 percent, what does that mean for next week.
Section 3: Cash and Customer
These two numbers tell you whether the money and the reputation are healthy.
| Metric | What It Tells You | Source | Cadence |
|---|---|---|---|
| Cash on hand plus 13-week forecast | Whether the company can make payroll next month | Accounting plus forecast | Weekly |
| Net Promoter Score or review average (rolling 30 days) | Whether the customer experience is healthy | Survey tool or review platform | Weekly |
These two numbers are the ones the owner cannot afford to be surprised on. Cash surprises put the business under. Reputation surprises put the business out. Both surface visibly when the owner looks at them every week.
The full scorecard fits on a single printed page. Color-coded red yellow green. Updated before the meeting starts, never during the meeting. If the data is not ready 30 minutes before the meeting, the meeting is canceled and rescheduled. The cadence is sacred. The data has to keep up with the cadence, not the other way around.
The 30-Minute Agenda That Stops the Meeting From Drifting
The agenda is the guardrail. Without one, the weekly meeting slides into the longest complaint in the room. With one, the meeting is over in 30 minutes because the questions are fixed and the answers are short.
Here is the agenda we install. The owner reads the number, the responsible person answers the headline question, the room agrees on the action if any, the owner moves to the next number.
| Time | Block | Owner | What Happens |
|---|---|---|---|
| 0:00 to 2:00 | Headline read | Owner | Owner reads the nine numbers out loud, names the reds, declares the meeting open |
| 2:00 to 12:00 | Revenue and pipeline walk | Sales lead or owner | Lead target, estimate value, close rate, weighted pipeline, decisions |
| 12:00 to 20:00 | Operations and crew walk | Ops lead or service manager | Jobs vs schedule, job margin, crew utilization, decisions |
| 20:00 to 25:00 | Cash and customer walk | Owner or office manager | Cash plus 13-week forecast, NPS or reviews, decisions |
| 25:00 to 28:00 | Open issues | All | Anything not on the scorecard that is blocking a department, one minute per issue |
| 28:00 to 30:00 | Decisions read back | Owner | Owner reads every decision made in the meeting, names the owner, names the due date |
The total is 30 minutes. If the meeting runs to 45 minutes, the agenda was wrong, not the cadence. The fix is fewer numbers, sharper questions, or a separate tactical meeting for deep dives. The weekly operations meeting is for steering, not for solving.
Why Most Weekly Meetings Fail Inside 90 Days
We have watched this cadence succeed inside a 9-person HVAC shop and a 90-person commercial plumbing company. We have also watched it collapse into a monthly complaint circle inside the first quarter. The collapses always come from the same five mistakes.
Mistake 1: The owner is not in the room. A weekly ops meeting run by the office manager turns into a status update the owner reads on Monday morning. The cadence is dead by week 6 because the owner stops reading the status. The fix is non-negotiable. The owner chairs.
Mistake 2: No scorecard, just conversation. Without a fixed one-page scorecard, the meeting slides into whoever has the loudest problem. The same three topics come up for three weeks, nothing changes, and the team stops trusting the cadence. The fix is print the scorecard, walk the scorecard, never let the conversation leave the scorecard.
Mistake 3: Discussion instead of decisions. The most common drift. The team spends 20 minutes talking about why the close rate dropped. The owner leaves the meeting with no action. The next week the close rate is still dropping. The fix is the rule: every red number ends with a written decision. Owner. Due date. Action.
Mistake 4: Too many numbers. A 14-metric scorecard with a 17-tab dashboard becomes a homework assignment nobody finishes. The meeting starts late because the data is not ready, then runs long because there are too many numbers to discuss. The fix is seven to nine numbers, one page, color-coded, in the same order every week.
Mistake 5: The data is not ready. This is the one that kills most rollouts. The office manager is supposed to update the scorecard before the meeting and the scorecard is never ready. The meeting gets canceled or pushed. The team stops treating it as sacred. The fix is two things. First, automate the scorecard so the data pulls from the CRM, the field service software, and the accounting system without a human touching it. Second, hard rule that the meeting starts on time regardless. If the data is wrong, fix the data after the meeting. The cadence does not wait.
AnovaGrowth Operating Insight: What This Looks Like Inside a Real Company
We run this cadence inside AnovaGrowth every Monday at 9 AM Eastern. The room is the owner, the head of delivery, the lead engineer, and the marketing lead. The scorecard is one page. The agenda is 30 minutes. The decisions are written into a shared doc before we stand up.
The honest truth is we did not start this way. We ran the business on reactive fire drills for two years. The week we installed the cadence, three things changed inside the first month:
- Problems surfaced on Monday instead of on Friday. The lead pipeline dropped in week 2. We caught it on Monday. By Friday we had a fix in place. Under the old cadence, we would have caught it in the monthly review and lost three weeks of lead flow.
- Decisions stopped living in the owner's head. Every decision had a name attached to it and a due date. Nothing fell through the cracks because the cracks were visible on the page.
- The team stopped waiting for the owner to react. The dispatcher knew the cash forecast by Friday of the previous week. The engineer knew the close rate by Monday morning. The team started steering their own week instead of waiting for the owner to call.
The cost is one hour per week across four people. The payback inside our own business has been the difference between running the company reactively and running it on a cadence.
How to Roll Out the Cadence Without Blowing Up the Team
The mistake most owners make is trying to install the full cadence on day one. The cadence that works is the one that gets installed in layers, with the team getting comfortable at each layer before the next one lands.
Week 1, install the meeting and the scorecard. Pick the day, the time, the room, and the four to seven attendees. Print the scorecard. Run the first meeting, even if the data is rough. The point in week 1 is the cadence, not the numbers.
Week 2, automate the data pulls. Wire the CRM, the field service software, and the accounting system to update the scorecard automatically. Most of the nine numbers above can pull from systems the company already pays for. The goal is zero manual data entry by week 3.
Week 3, sharpen the questions. Once the data is clean, tighten the questions on each number. Replace vague questions with specific ones. Instead of "how is the pipeline," ask "what is our weighted pipeline coverage ratio against the next 60-day revenue target, and what two deals would move it most."
Week 4, install the decision log. Every decision from the meeting gets logged in a shared document with owner, due date, and status. The next meeting opens with a 90-second review of last week's decisions. Closed, in progress, overdue. The decision log is the single highest-leverage habit in the entire cadence.
Month 2, add the open issues block. Once the scorecard and decision log are stable, add a structured open issues block. Three issues per department per week, one minute each, decision or punt.
Month 3, retire the monthly review. Once the weekly cadence is stable, the monthly leadership review becomes redundant. The data is fresh, the decisions are tracked, the issues are visible. The monthly review can shift to a quarterly strategic offsite instead.
By the end of month 3, the owner should be looking at the same nine numbers every Monday, asking the same five questions, walking out of the room with a written list of decisions, and spending the rest of the week steering instead of reacting. That is when the cadence starts compounding.
What to Watch Out For in the First 90 Days
Three failure modes show up in every rollout.
Failure mode 1: The meeting becomes a status update. When the team reads the numbers to the owner without decisions, the meeting turns into a report the owner could have read in an email. The fix is to never let a number be read without a decision attached if it is red. Read the number, name the action, name the owner, name the due date. Move on.
Failure mode 2: The owner dominates the meeting. The owner has strong opinions on every number, and the team stops bringing data because the owner will override them anyway. The fix is to ask questions instead of giving answers. "What is the close rate this week?" not "The close rate is bad, fix it." Let the team propose the action. The owner approves or redirects.
Failure mode 3: The cadence gets dropped when things get busy. The week the schedule blows up, the meeting gets canceled. The next week, it gets canceled again. By week 6 the cadence is gone. The fix is the hard rule. The meeting happens regardless of how busy the week is. If the room cannot make it, the meeting moves to a different day the same week, but it happens.
Where to Start
If you run a service business and want to install the cadence, the first move is to pick the nine numbers and put them on a single page. Do not start with software. Do not start with a dashboard. Start with the nine numbers and the agenda. The first meeting can run on a printed spreadsheet and a whiteboard.
The numbers that matter for your business may differ slightly from the nine above. The structure does not. Revenue and pipeline, operations and crew, cash and customer. Seven to nine metrics. One page. Same order every week. Color-coded. Updated before the meeting, not during.
Within a month, the cadence will surface two or three problems that were already happening and that nobody was steering on. Those problems, fixed while they are still small, are the entire payback of the weekly operations meeting. Everything after that is compounding.
Want help installing the cadence in your service business? Contact us and we will walk through your current review cycle, the data sources you already pay for, and the nine numbers that belong on your scorecard. We work with service companies in the Southeast and remotely across the US. For the data side of the cadence, our service business KPI guide covers the metrics that actually predict profitability. For the automation layer that pulls the scorecard together, our CRM integration playbook covers the data plumbing the cadence depends on. And for the broader operating rhythm, our Q4 year-end planning playbook shows how the weekly cadence ties into the quarterly and annual planning rhythm.
Related articles

Service Business Year-End Planning Playbook: Q4 Tax Prep, Operations Tune-Up, and the Setup That Wins Q1
Most service businesses lose Q4 to last-minute scramble and limp into Q1 with bad books. A 90-day Q4 plan fixes tax, cash, hiring, and ops in one sweep.
Read the article: Service Business Year-End Planning Playbook: Q4 Tax Prep, Operations Tune-Up, and the Setup That Wins Q1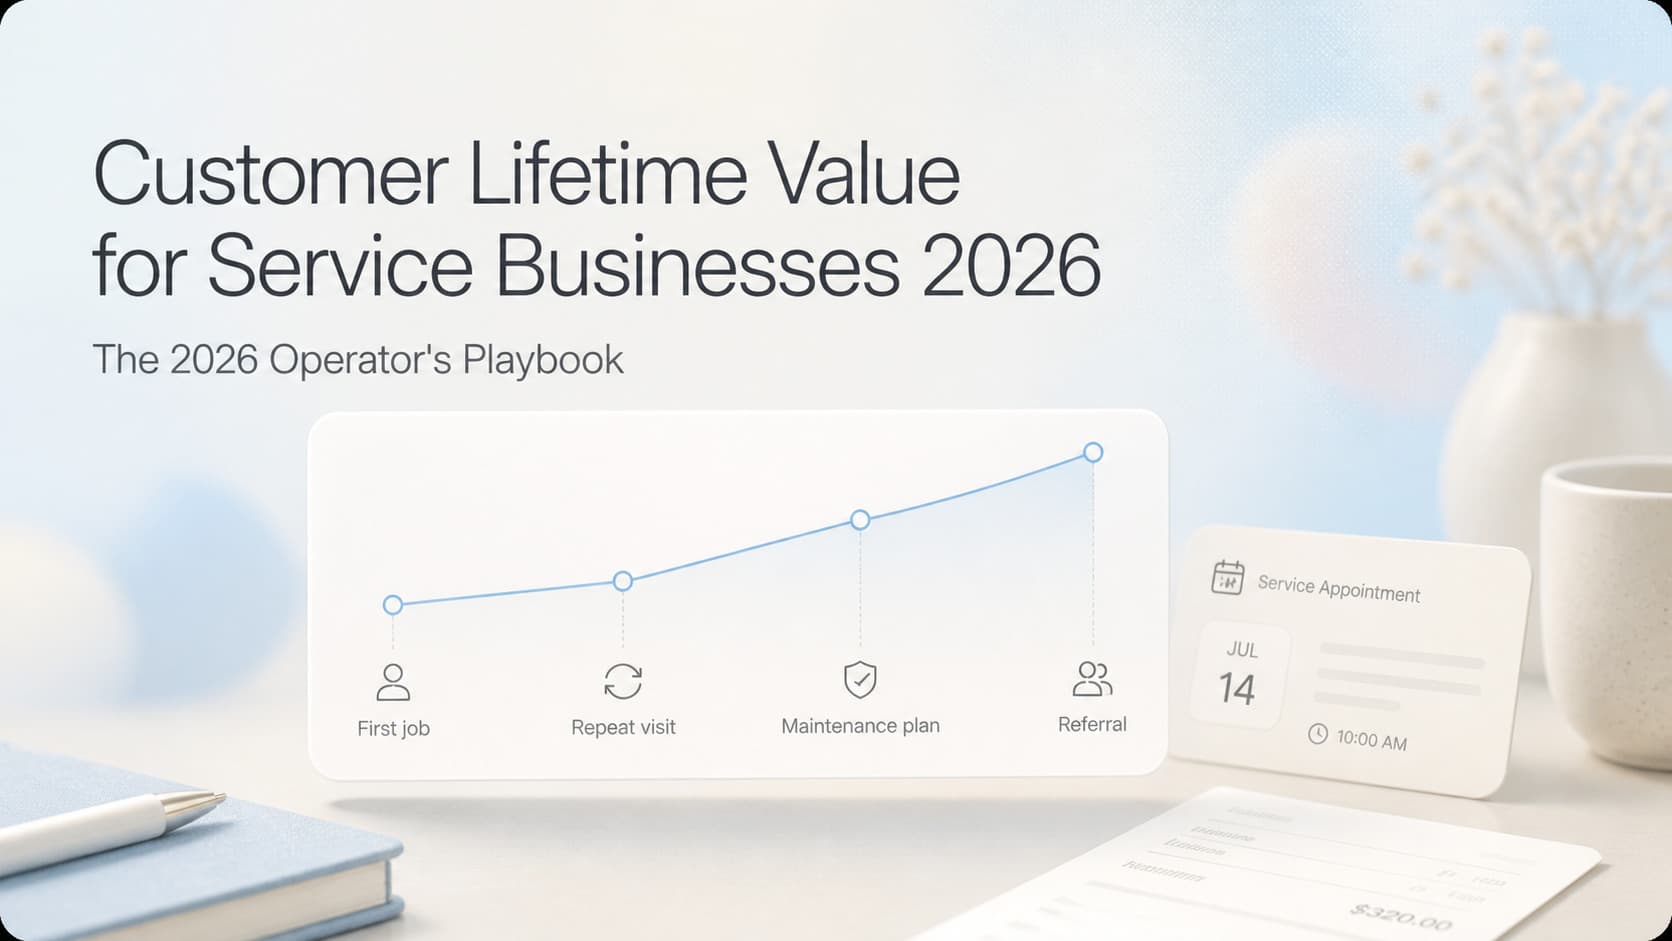
Customer Lifetime Value for Service Businesses: The 2026 Operator's Playbook
Customer lifetime value is the number every service business should run on. Here is the formula, the segmentation, and the automation that actually grows it.
Read the article: Customer Lifetime Value for Service Businesses: The 2026 Operator's Playbook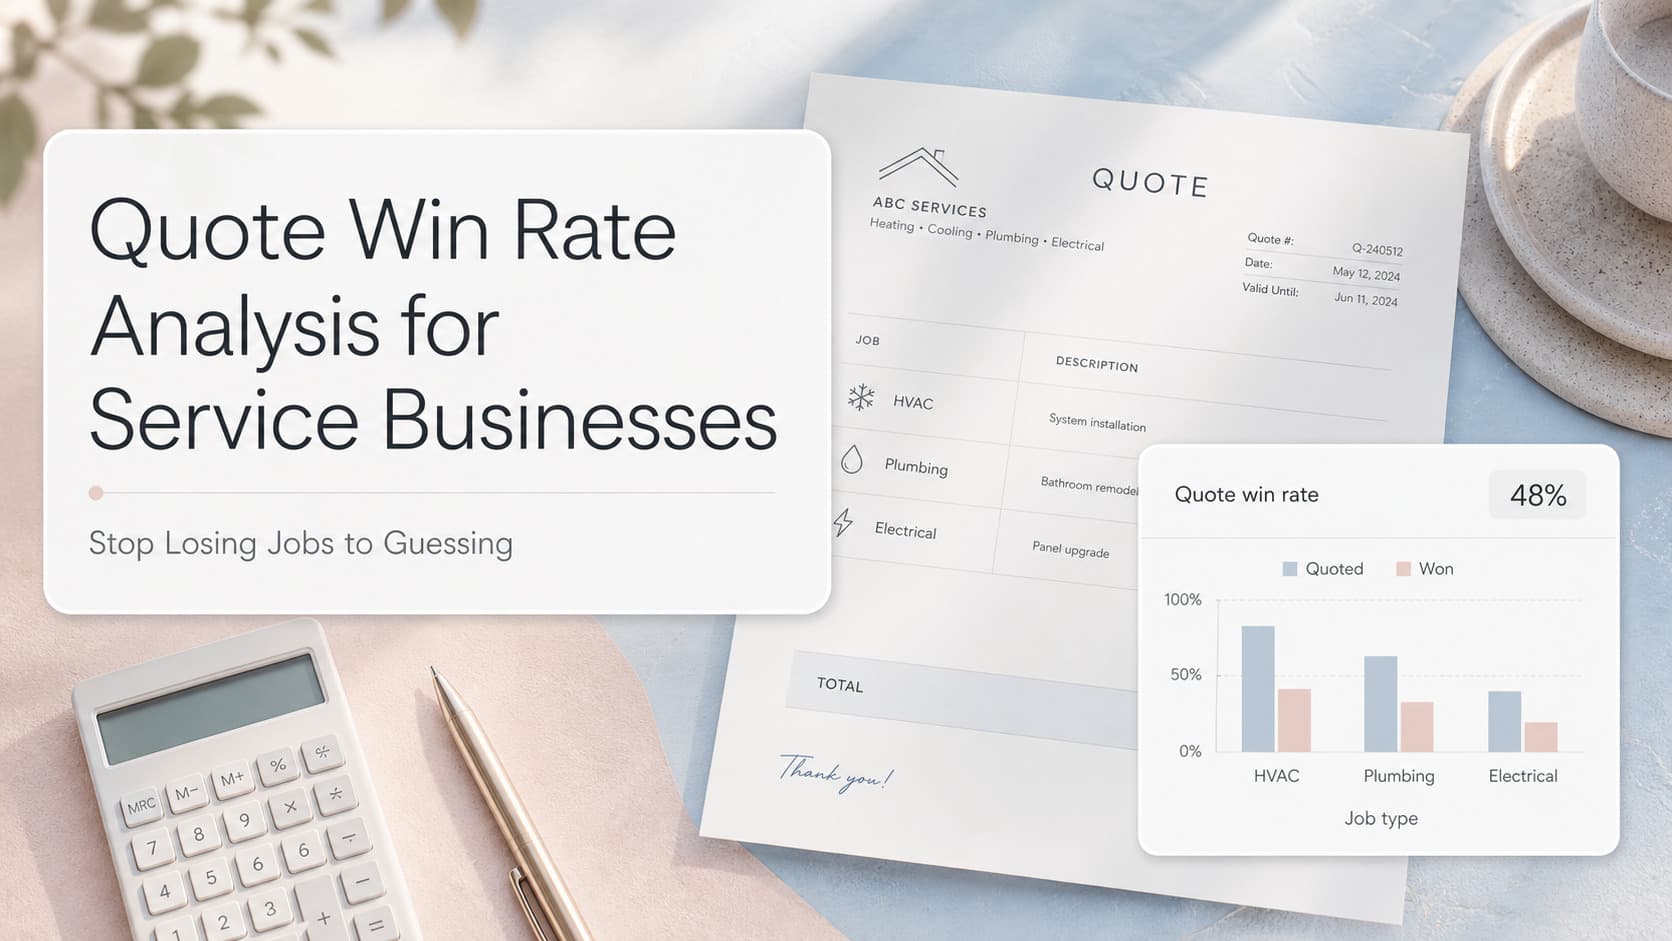
Quote Win Rate Analysis for Service Businesses: Stop Losing Jobs to Guessing
Service businesses that track quote win rate by job type, source, and price point close 20-30% more work. Here is how to run the analysis.
Read the article: Quote Win Rate Analysis for Service Businesses: Stop Losing Jobs to Guessing
