Quick answer: Quote win rate analysis is the practice of tracking every estimate you send, marking it as won or lost, and slicing the data by job type, lead source, price point, and salesperson. Service businesses that run this analysis consistently close 20-30% more work without sending more quotes, because they stop guessing which jobs to chase and start quoting smarter. Most CRMs already have the data needed; you just need to tag won and lost quotes the same way every time.
The Quote Black Hole
Most service businesses treat quotes as throwaway documents. You write the estimate, send it, and hope the customer calls back. If they do, great. If they don't, you move on to the next one.
The problem is that every quote you send is a data point. When you ignore it, you are throwing away the most useful information your business generates: what actually makes customers say yes.
Without win rate analysis, you cannot answer basic questions:
- Which job types do we win most often? The ones you should quote more of.
- Which lead sources produce the highest close rate? The ones worth more ad spend.
- Are we too expensive or too cheap? Average price per won vs. average price per lost quote.
- Where in the follow-up do we lose jobs? After the first quote, second quote, third call.
- Do certain sales reps close better? Who needs coaching, who is your closer.
At AnovaGrowth, we have audited quote flows for service businesses in HVAC, plumbing, electrical, roofing, and commercial services. The pattern is almost identical: owners think they win about 50% of their quotes. The actual data usually shows 25-35%. The gap between perceived and actual win rate is where revenue goes to die.
How to Set Up Quote Win Rate Tracking
You do not need a new tool. You need a discipline. The data is already in your CRM, estimating software, or even a spreadsheet. You just need to mark every quote the same way every time.
Step 1: Add a "Quote Outcome" Field
Create a custom field on your quote or opportunity record with these values:
| Outcome | When to Use |
|---|---|
| Won | Customer signed and scheduled |
| Lost - Price | Customer said a competitor was cheaper |
| Lost - Timing | Customer said not right now or next year |
| Lost - No Response | Customer stopped responding after 2+ follow-ups |
| Lost - Scope | Customer's needs did not match what you quoted |
| Lost - Other | Anything else; add a note |
The categories matter. "Lost" with no detail is useless. "Lost - Price" tells you something different than "Lost - Timing". The first is a pricing problem. The second is a follow-up problem.
Step 2: Tag Every Quote Within 30 Days
Set a rule: every quote gets tagged within 30 days of being sent. Use a CRM automation to nudge the salesperson to update the status. If no one updates it, the system auto-marks it as "Lost - No Response".
This discipline is what creates usable data. The day you stop tagging is the day your analysis becomes junk.
Step 3: Pull the Numbers Monthly
Once you have 60-90 days of tagged quotes, you can start running analysis. Most CRMs have built-in reporting that lets you group by any field. If you have a custom CRM or spreadsheet, you can pivot the data in 5 minutes.
What to Measure: The 5 Numbers That Matter
1. Overall Win Rate
Win rate = Won quotes / Total quotes sent
This is the headline number. Track it monthly and watch for trends. If your win rate is below 30%, you have a pricing, follow-up, or targeting problem. If it is above 50%, you are probably undercharging.
Industry benchmarks (rough, service-specific):
- HVAC repair: 40-60%
- HVAC replacement: 25-40%
- Plumbing service: 50-70%
- Electrical service: 40-60%
- Roofing replacement: 20-35%
- Commercial services: 30-50%
Use these as a starting reference, not a target. Your market, price point, and reputation will shift the benchmark.
2. Win Rate by Job Type
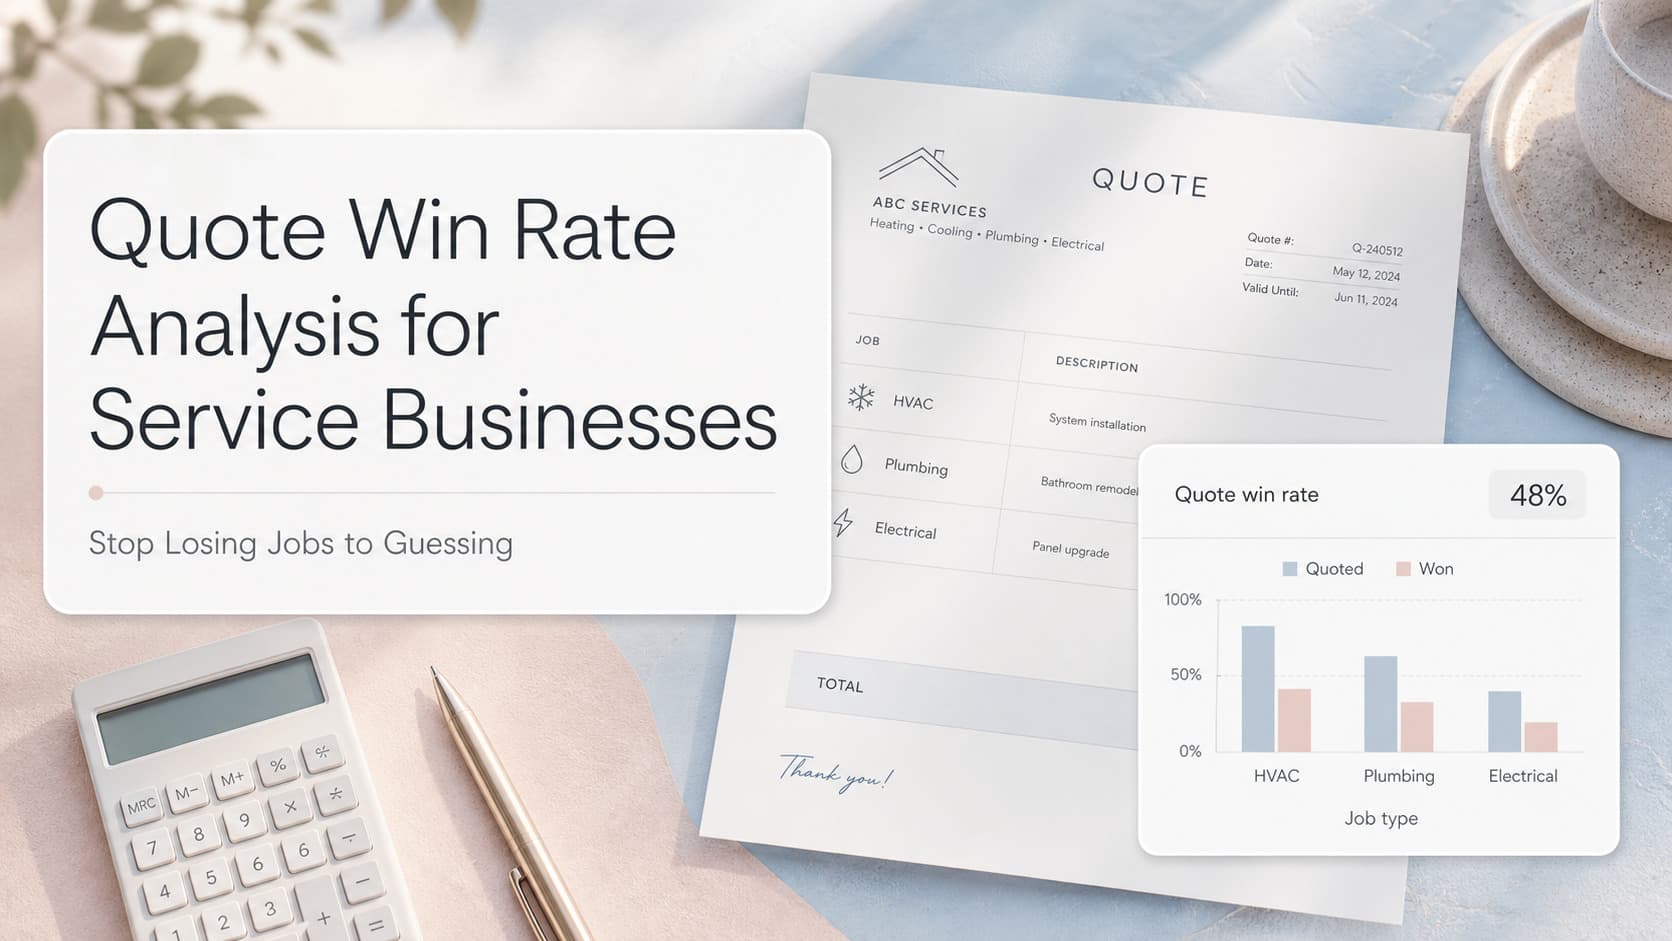
Group quotes by the type of work. You will almost always find that some job types you win 60% of the time and others you win 15%. The first is where you should focus sales effort. The second is where you need to fix scoping, pricing, or marketing.
Example: A landscaping company might win 65% of weekly maintenance quotes but only 20% of full redesign projects. That tells them redesigns are priced wrong, or the leads are not qualified, or the sales process for redesigns is broken.
3. Win Rate by Lead Source
Which sources actually produce work? Most service businesses assume Google and referrals are best. The data often shows something different.
Example: A plumbing company found that Google Ads leads won 35% of the time, but website contact form leads won 52%. They were spending 70% of their ad budget on Google Ads. After the analysis, they shifted 30% of budget to content that drove organic form fills, and total revenue went up 18% without raising ad spend.
4. Win Rate by Price Tier
Quotes under $1,000 win at very different rates than quotes over $10,000. Track separately.
Small jobs are usually won on speed and convenience. Large jobs are won on trust, references, and relationship. If your small job win rate is low, you have a response time problem. If your large job win rate is low, you have a sales process or credibility problem.
5. Time to Win and Time to Lose
Track how many days between quote sent and quote won (or lost). This tells you when customers make decisions.
Example: A roofing company found that 70% of their wins happened within 7 days of sending the quote. After 14 days, the odds dropped to under 10%. They restructured their follow-up sequence to focus energy on the first 7 days and stopped chasing quotes after 21 days. Same number of quotes, more wins.
Reading the Data: Three Patterns That Show Up
Pattern 1: Win Rate Drops After the First Quote
If your first quote win rate is 30% but your second quote win rate is 50%, customers are price-shopping and you are losing the first round. The fix is to either quote higher authority, frame your quote differently, or qualify harder before sending estimates.
If your first quote win rate is 50% but your second quote is 10%, you are rushing the first quote. The second quote is the "real" one after customers push back. You need to slow down and quote correctly the first time.
Pattern 2: You Win Low-Value Jobs and Lose High-Value Jobs
This is the most common pattern in service businesses. Small jobs win because they are easy to book. Big jobs lose because they require trust, references, and a sales process most service businesses do not have.
The fix is to build a separate sales process for high-value jobs. Site visits, references, financing options, and a longer follow-up cycle. Small jobs can stay on the fast track.
Pattern 3: Win Rate Varies Wildly by Salesperson
If one rep wins 60% and another wins 20%, something is different about their process. Get the closer to teach the others. Use call recordings, ride-alongs, or quote reviews to figure out what the closer does differently.
At AnovaGrowth, we have watched one dispatcher with a 65% win rate train a team of 4 others to hit 45% within 90 days. The data identifies the gap. The closer closes the gap.
Example: Win Rate Analysis in Action
A commercial cleaning company doing $1.8M per year in the Southeast was convinced their Google Ads were failing. They were spending $14K/month and getting 70-90 leads per month. They thought win rate was around 25%.
We pulled 6 months of quote data and tagged everything by outcome. The actual numbers:
| Metric | Their Estimate | Actual |
|---|---|---|
| Quotes sent per month | n/a | 58 |
| Win rate | 25% | 41% |
| Avg. won quote value | n/a | $3,200 |
| Avg. lost quote value | n/a | $4,800 |
| Win rate, Google Ads leads | n/a | 32% |
| Win rate, referral leads | n/a | 68% |
| Win rate, under $2K | n/a | 58% |
| Win rate, over $5K | n/a | 22% |
Three things jumped out:
- They were winning more than they thought. The 41% win rate was healthy.
- They were winning low-value jobs and losing high-value jobs. The average won quote was $3,200 but the average lost quote was $4,800. They were leaving the bigger money on the table.
- Referrals crushed it (68% win rate) but only made up 20% of leads. They had a referral problem, not an ads problem.
Within 90 days, they launched a structured referral program, added financing to their quotes over $5K, and shifted three high-value proposals to a more consultative sales process. Revenue went from $1.8M to $2.4M annual run rate without spending more on ads.
The data told the story. The owners had been guessing.
Setting Up the Reports
You do not need a fancy BI tool. Most CRMs have built-in reporting that handles this.
HubSpot: Custom report on deals grouped by quote outcome, deal source, and amount.
Salesforce: Report on Opportunities with a filter on Quote Status and grouping by Lead Source.
HighLevel: Pipeline report with custom fields for outcome and amount.
Jobber / ServiceTitan: Quote reports with status and loss reason fields.
Spreadsheet: Quote log with columns for date sent, amount, outcome, source, and notes. Pivot table does the rest.
The tool matters less than the discipline. Pick what you already use. The key is consistent tagging.
Common Mistakes When Running Quote Win Rate Analysis
Not tagging every quote. If you tag only some quotes, the data is biased toward the ones you remember. The missed ones are usually the losses.
Too many lost-reason categories. Keep it to 5-6. If you have 20 categories, no one will use them. If you have 2, you cannot act on the data.
Looking at the data once. Win rate analysis is a monthly habit. The first report is interesting. The fifth is where you see patterns.
Hiding the numbers from the team. If your sales team does not see their own win rate, they cannot improve. Share the data openly. Make it a coaching tool, not a punishment tool.
Ignoring the quote value. Win rate without value is misleading. Winning 60% of $500 quotes is worse than winning 25% of $8K quotes. Track both.
Related Questions
- How do I track quote outcomes in my CRM or estimating software?
- What is a good quote win rate for a service business?
- How do I increase quote win rate without lowering prices?
- Should I track win rate by salesperson or by team?
- How long should I wait before marking a quote as lost?
- What is the difference between quote win rate and sales close rate?
Key Takeaways
- Quote win rate analysis turns your estimating data into a coaching tool
- Tag every quote as won or lost with a specific reason within 30 days
- Track win rate by job type, lead source, price tier, and salesperson
- A 60% first-quote win rate and 10% second-quote win rate means you are not quoting right the first time
- Most service businesses are leaving bigger jobs on the table, not smaller ones
- Win rate analysis is a monthly habit, not a one-time audit
Next Steps
The fastest way to start is to pull your last 30 sent quotes and tag them. Not 100%, not 200%. Just the last 30. Once you have the discipline of tagging in batches, you can build the reporting and start finding patterns.
If you already have tagged data sitting in your CRM but no reports built, the analysis itself takes a few hours. The upside is usually a 15-25% gain in close rate within two quarters.
Want help building the reports and reading the data? Contact us to set up a quote win rate audit for your service business.
Related reading: CRM Pipeline Management for Service Businesses covers how to use pipeline data alongside quote outcomes. Quote Follow-Up Automation for Service Businesses walks through the automation side of closing more quotes. Service Business KPIs Beyond Revenue shows the other metrics that pair with win rate to give you the full picture.