CRM Dashboard Metrics That Matter for Service Businesses
Most service businesses track the wrong CRM metrics. Here is what to measure instead to know which jobs are profitable and which leads convert.

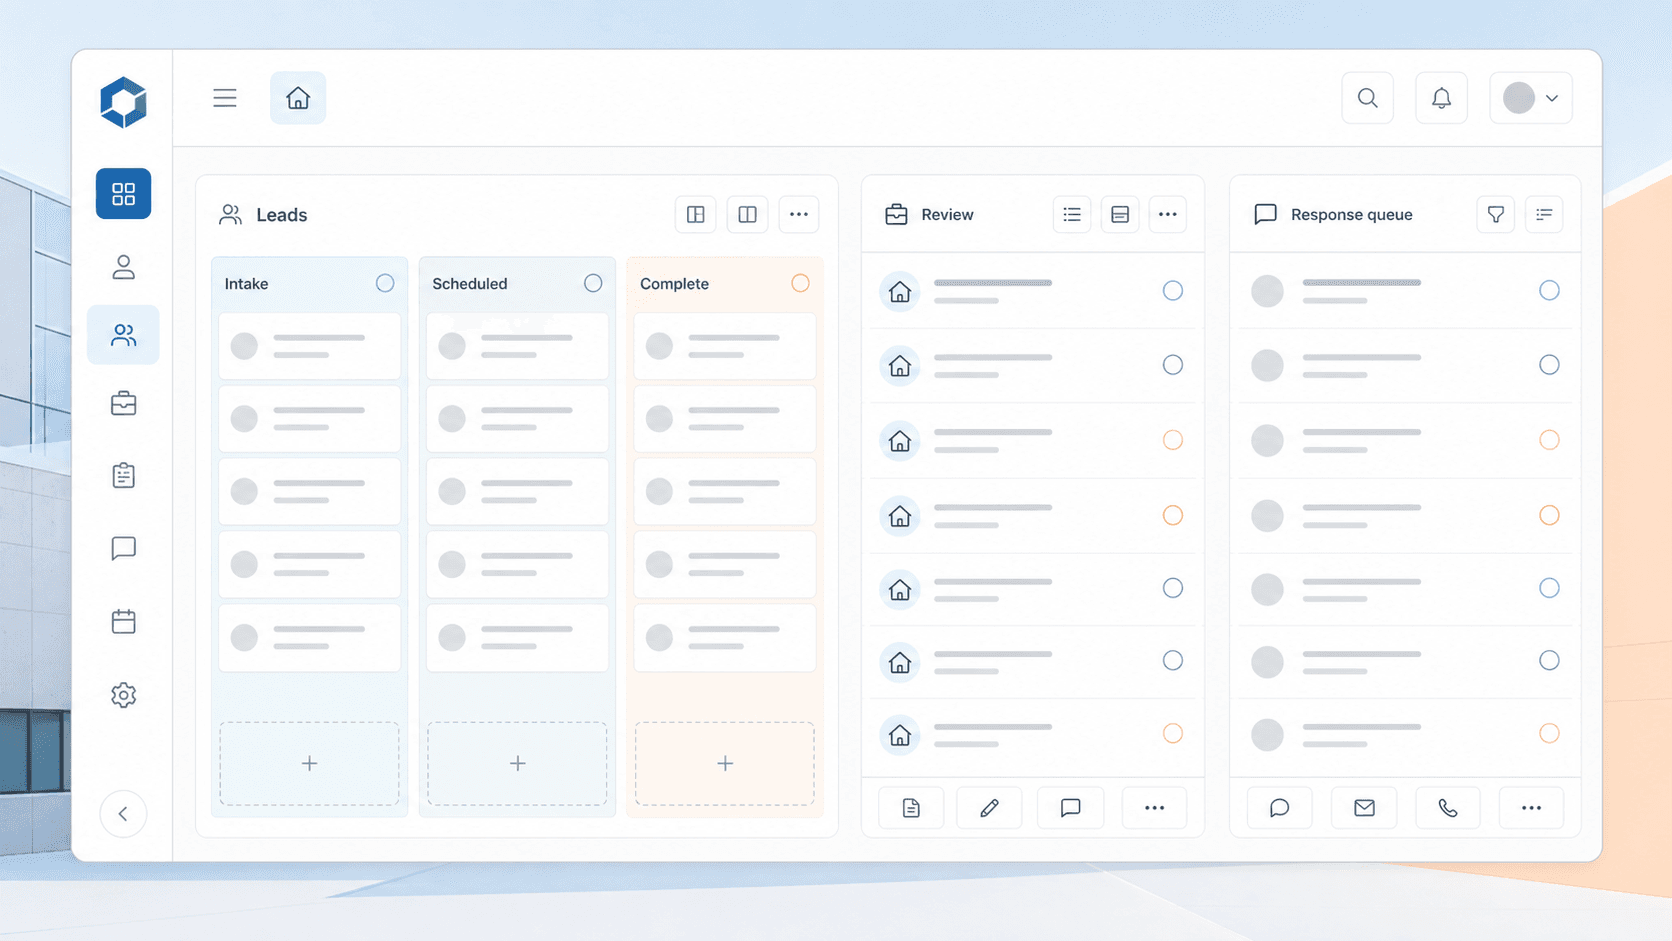
Quick Answer: What Should Your CRM Dashboard Actually Show?
A useful CRM dashboard for a service business tracks three things: lead velocity (how fast leads move through your pipeline), job profitability (actual margin per job, not just revenue), and operations health (response times, completion rates, and repeat customer percentage). If your dashboard does not show these three categories, it is showing you vanity metrics. Strip it down and rebuild it around the numbers that tell you whether your business is getting better or worse week over week.
The Problem: Most Service Business Dashboards Are Useless
Walk into any HVAC, plumbing, electrical, or field service company and ask to see their CRM dashboard. Nine times out of ten, you will see a screen full of numbers that look impressive but tell you nothing useful.
Total leads this month. Total revenue. Number of active customers. These are vanity metrics. They make you feel busy without telling you whether your operations are actually healthy.
Here is what happens in practice. A business owner opens their CRM, sees 200 leads this month, and feels good. What they do not see is that 140 of those leads never got a follow-up call. Or that the average response time is 47 hours. Or that 60% of their revenue comes from jobs that actually lose money after truck rolls and labor are factored in.
The CRM dashboard should be the first place you look to understand the health of your business. But most service businesses have never set theirs up to show the right things.
The Three Metric Categories That Matter
1. Lead Velocity Metrics
These tell you whether your marketing and sales process is actually working. Not just how many leads came in, but how fast they move and how many convert.
Response time. This is the single most predictive metric for service businesses. A lead that gets a response within 5 minutes converts at 9x the rate of a lead that waits 30 minutes. Your dashboard should show average response time by day and week, and it should flag any lead that has been waiting longer than your target threshold.
Lead-to-quote rate. How many inbound leads turn into an actual quote or estimate? If this number drops below 60%, your intake process is broken. Leads are falling through the cracks between the phone call and the estimate.
Quote-to-close rate. Of the quotes you send, how many turn into booked jobs? Industry benchmarks for home services hover around 30-40%. If yours is lower, your pricing, follow-up, or presentation needs work.
Average time from lead to booked job. This is your pipeline velocity. A shorter time means less opportunity for the lead to shop around or go cold. If this stretches beyond 72 hours for emergency services or 7 days for scheduled work, you are losing jobs to competitors.
2. Job Profitability Metrics
Revenue is a vanity metric. Profit per job is the truth. Most CRMs do not calculate this automatically because they do not talk to your accounting software. But a properly integrated CRM dashboard can show you the real picture.
Average job margin. Total revenue minus direct costs (materials, labor, truck roll) divided by number of jobs. If this number is trending down, your pricing is not keeping up with costs or your dispatch is inefficient.
Jobs below target margin. How many jobs fall under your minimum acceptable margin? If more than 20% of jobs are below target, you have a pricing, scoping, or dispatch problem that needs attention.
Revenue per technician hour. This is the number that tells you whether your field team is productive. Divide total job revenue by total technician hours worked. A declining number means your team is spending more time on site for less money.
Repeat customer rate. The percentage of jobs that come from previous customers. Service businesses with a repeat rate above 40% spend significantly less on marketing and have higher average job values. If yours is below 20%, your retention process is broken.
3. Operations Health Metrics
These tell you whether your day-to-day operations are running smoothly or bleeding efficiency.
First-time fix rate. For service businesses, this is the percentage of jobs resolved on the first visit. Every return trip costs you money and frustrates the customer. A rate below 85% means your dispatch is sending the wrong tech or the wrong parts.
Schedule utilization. What percentage of your available technician hours are actually booked? If this drops below 75%, you have excess capacity or your scheduling process is leaving gaps.
Inbound call answer rate. How many calls get answered versus go to voicemail or ring out? Service businesses that answer 90%+ of calls within 30 seconds book 40% more jobs than those answering 60% or less.
Customer acquisition cost by channel. Which marketing channels actually produce profitable jobs? Your CRM should track the source of every lead and calculate the cost to acquire that customer against the lifetime value of the jobs they book.
Decision Table: Which Metrics to Track by Business Stage
| Business Stage | Focus Metrics | Why |
|---|---|---|
| Startup (under 50 jobs/month) | Response time, lead-to-quote rate, average job margin | Build the foundation before scaling |
| Growth (50-200 jobs/month) | Quote-to-close rate, schedule utilization, repeat customer rate | Optimize the machine before adding more fuel |
| Scale (200+ jobs/month) | First-time fix rate, revenue per technician hour, CAC by channel | Find the inefficiencies hiding in volume |
| Mature (established, stable) | All of the above, plus trend lines over 12+ months | Catch problems before they become trends |
How to Build This Dashboard Without a Data Team
Most service businesses do not have a dedicated analytics person. You do not need one. Here is the practical approach.
Step 1: Pick your CRM wisely. Not every CRM exposes the data you need. If your CRM cannot show you response times, lead stage durations, and job-level profitability, you will be fighting the tool every step of the way. Look for platforms that offer custom dashboards, pipeline analytics, and integration with your accounting software.
Step 2: Connect your tools. Your CRM is only as useful as the data it receives. If your phone system does not log calls into the CRM, you cannot track response times. If your invoicing software does not sync job costs back to the CRM, you cannot calculate margins. A proper CRM integration connects your phone system, scheduling platform, accounting software, and marketing channels into one data flow.
Step 3: Set up automated data collection. Manual data entry is the enemy of accurate dashboards. Every time a technician has to log something by hand, the data will be incomplete or wrong. Automate the capture of call logs, appointment status changes, invoice amounts, and customer follow-ups so your dashboard updates itself.
Step 4: Build three views. Create one dashboard for lead velocity, one for job profitability, and one for operations health. Do not cram everything into a single screen. Each view should answer a specific question: Are we getting enough leads? Are we making money on the work we do? Is our operations team running efficiently?
Step 5: Review weekly, not daily. The biggest mistake business owners make is checking their dashboard every day and reacting to noise. Pick one day per week to review your metrics. Look for trends over 4-8 weeks, not daily fluctuations. A single bad day is noise. A four-week trend is a signal.
First-Hand Insight: What We See When We Set Up Dashboards for Clients
At AnovaGrowth, we have set up CRM dashboards for about two dozen service businesses across HVAC, plumbing, electrical, and home services. The pattern is almost always the same.
The business owner comes to us saying they need more leads. They are looking at their dashboard and seeing lead volume flat or declining. They want to spend more on marketing.
When we dig into the actual data, we almost always find the same thing. The lead volume is fine. The problem is that 40-60% of leads are not getting followed up within 24 hours. The response time is measured in hours, not minutes. The quote-to-close rate is below 20%.
These businesses do not need more leads. They need to fix what happens to the leads they already have. A CRM dashboard that shows response time and quote-to-close rate would tell them this immediately. But most of them were looking at total lead count and total revenue, which hid the real problem.
The fix is almost always the same: automate the follow-up process, set up lead routing rules, and track the metrics that actually measure whether leads are being handled properly. Once those numbers improve, the lead volume problem usually disappears.
Proof: What Happens When You Track the Right Metrics
A plumbing company in the Southeast with 8 trucks and 12 technicians was spending $4,000 per month on Google Ads. Their CRM dashboard showed 150 leads per month and $80,000 in monthly revenue. The owner thought things were fine.
We set up a proper dashboard that tracked response time, lead-to-quote rate, and job margin. The data told a different story.
Average response time was 6 hours. Only 35% of leads ever received a quote. Of the quotes sent, only 18% converted. And the average job margin was 22%, well below the 35% target.
The owner was spending $4,000 per month to generate leads that were being ignored. The fix was not more ad spend. It was automating the lead response process, setting up instant quote generation, and implementing a follow-up sequence for quotes that did not close within 48 hours.
Within 60 days, response time dropped to under 5 minutes, quote-to-close rate rose to 34%, and revenue increased by 40% without any additional ad spend. The dashboard showed the problem clearly once the right metrics were in place.
Related Questions Worth Exploring
- What is the difference between a CRM dashboard and a business intelligence dashboard, and which one does my service business need?
- How do I calculate customer lifetime value for a service business that does recurring maintenance and one-off repairs?
- What CRM platforms offer the best custom dashboard features for field service companies?
- How often should I update my dashboard metrics and what triggers a change in what I track?
- Can I build a useful CRM dashboard with Google Data Studio or do I need a dedicated analytics tool?
- What is the minimum data set I need before a CRM dashboard becomes useful?
What This Means for Your Business
If your CRM dashboard shows you total leads and total revenue, you are flying blind. Those numbers can look great while your business is bleeding money on unprofitable jobs, slow response times, and broken follow-up processes.
Build your dashboard around the three categories that actually matter: lead velocity, job profitability, and operations health. Connect your tools so the data flows automatically. Review the numbers weekly and look for trends, not daily noise.
The right dashboard will not just make you feel informed. It will tell you exactly where to focus your time and money to make your business more profitable.
Ready to build a CRM dashboard that actually tells you what is working? Contact us to discuss how we can set up your CRM with the right metrics, integrations, and automated data flows.
Want to learn more about CRM integration for service businesses or how to clean up your CRM data before adding automation?
Related articles
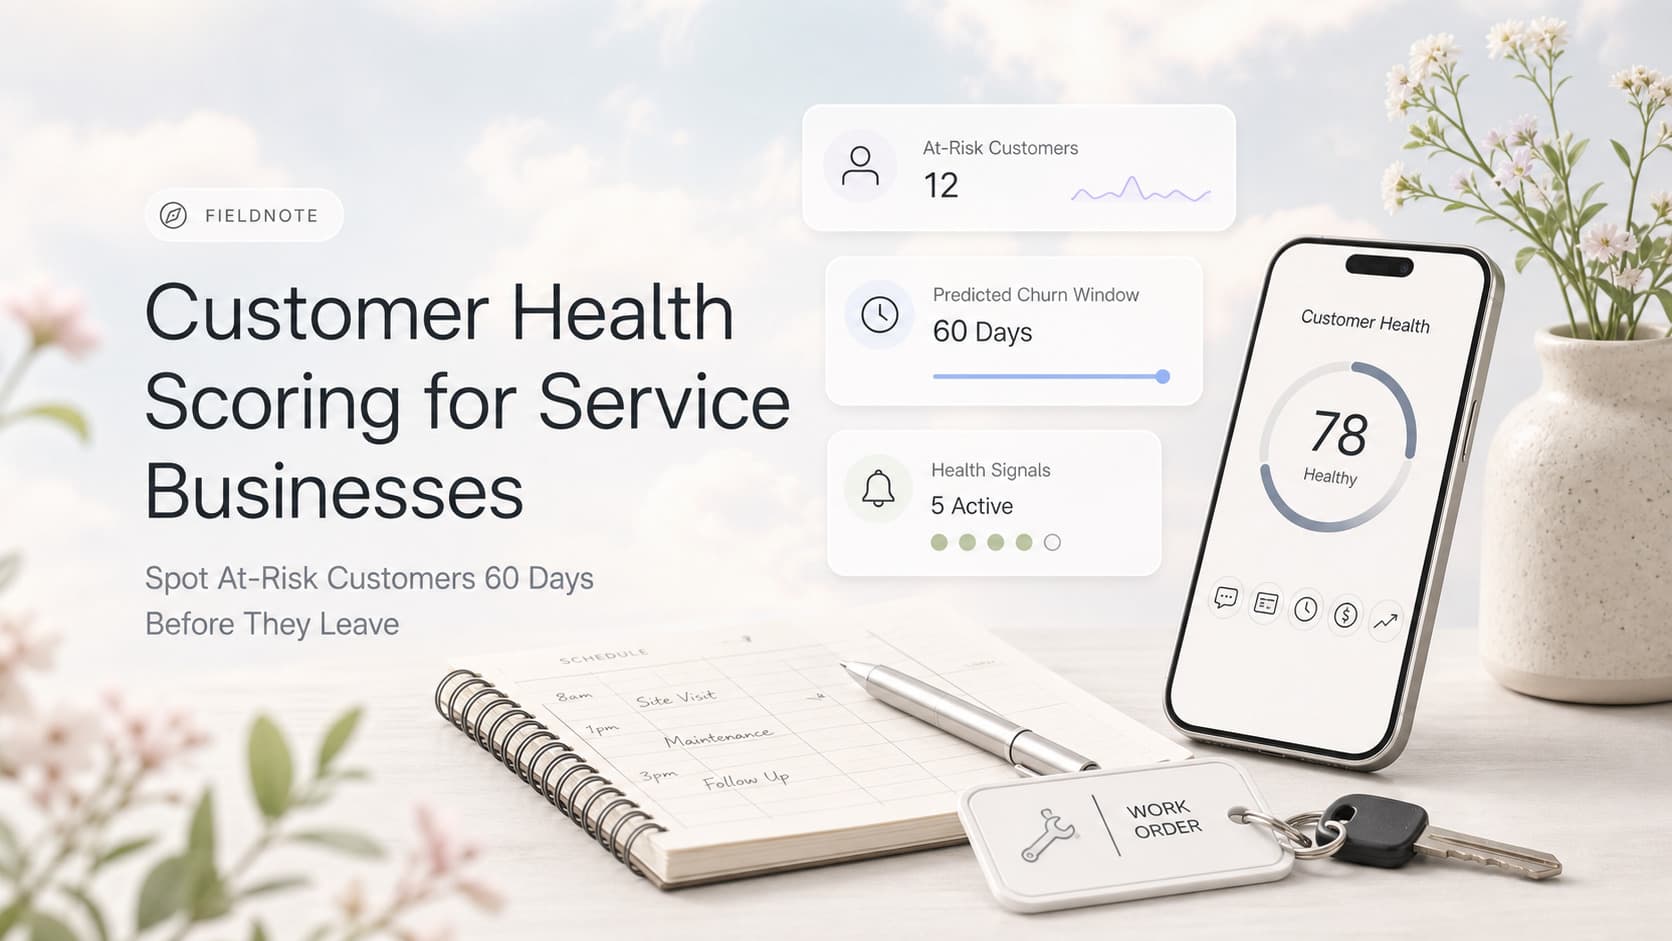
Customer Health Scoring for Service Businesses: Spot At-Risk Customers 60 Days Before They Leave
Service businesses that score customer health on five signals catch 70-80% of churn 60-90 days before it happens. Here is the model, the math, and the workflow.
Read the article: Customer Health Scoring for Service Businesses: Spot At-Risk Customers 60 Days Before They Leave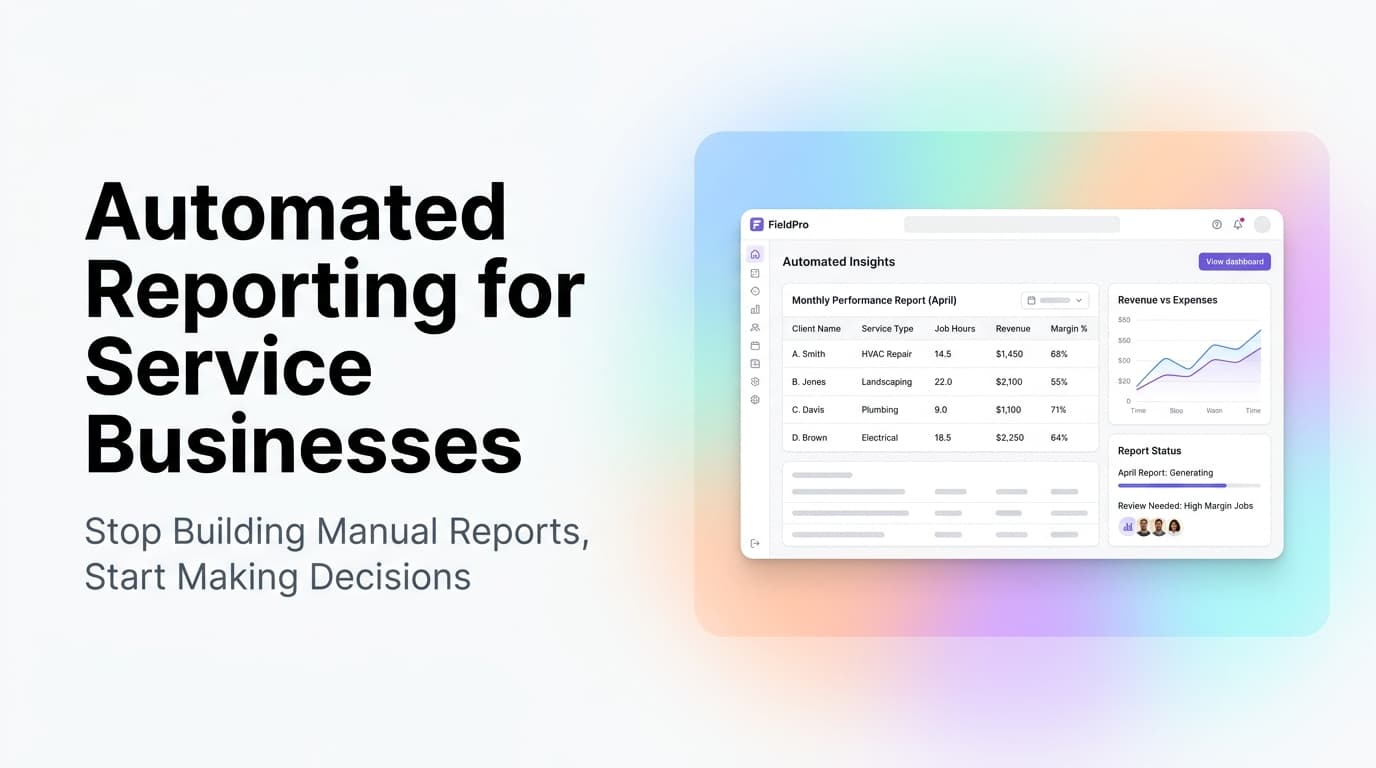
Automated Reporting for Service Businesses: Stop Building Manual Reports, Start Making Decisions
Service businesses spend 8-12 hours per month on manual reports. Automated reporting cuts that to zero and surfaces insights you would miss.
Read the article: Automated Reporting for Service Businesses: Stop Building Manual Reports, Start Making Decisions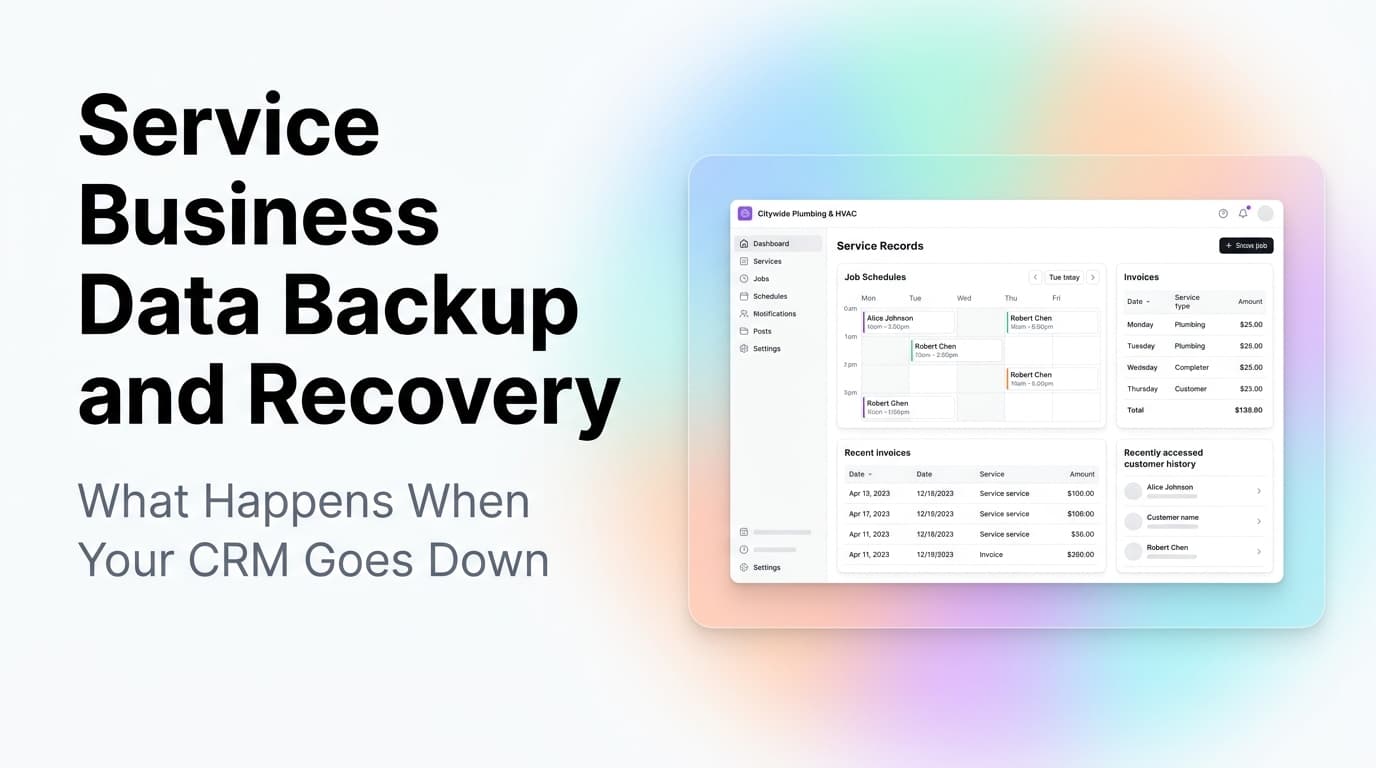
Service Business Data Backup and Recovery: What Happens When Your CRM Goes Down
When your CRM goes down, you lose access to customer history, job schedules, and invoices. Here is how service businesses protect their data and recover fast.
Read the article: Service Business Data Backup and Recovery: What Happens When Your CRM Goes Down
