Data-Driven Decision Making for Service Businesses: Turn Your Operations Data Into a Competitive Advantage
Service businesses sit on a goldmine of CRM, scheduling, and job-costing data. Here is how to use it to make better pricing, staffing, and growth decisions.

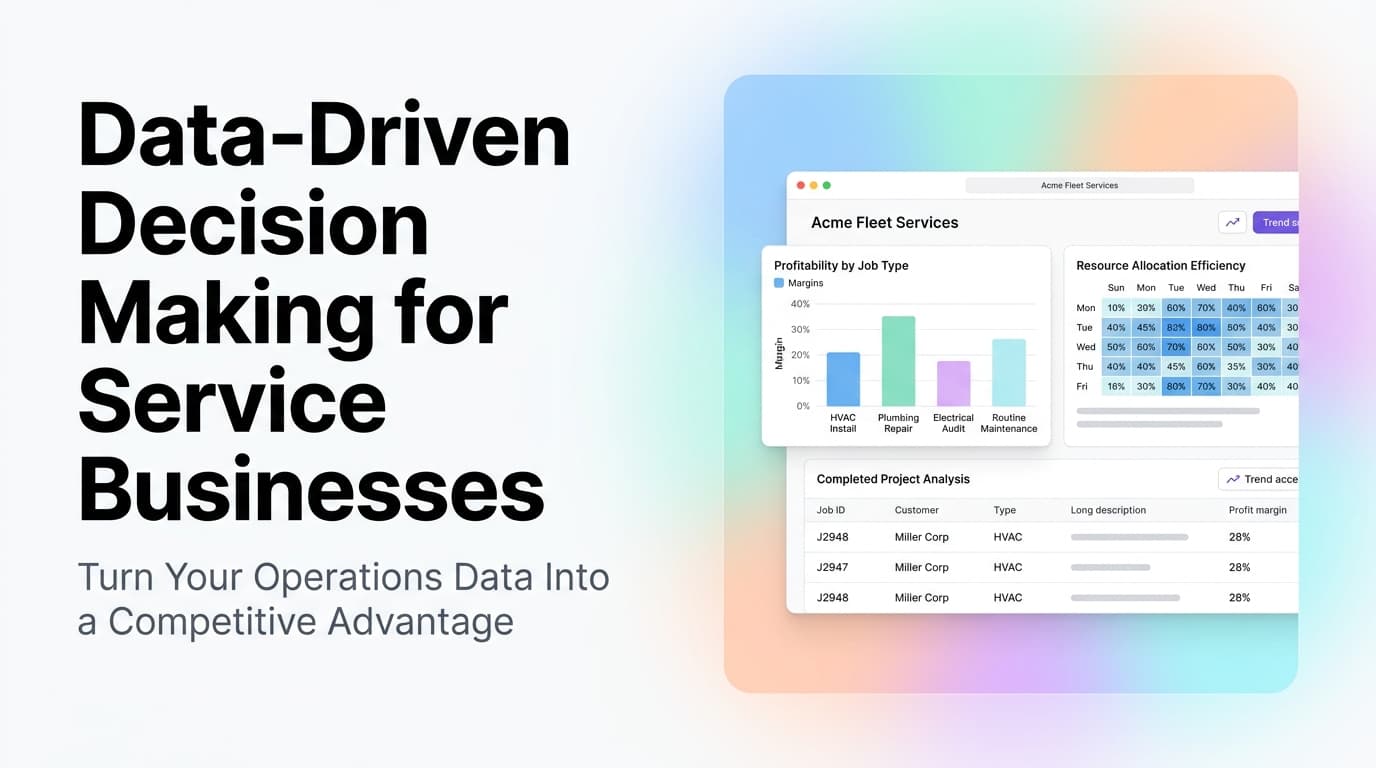
Quick answer: Data-driven decision making for service businesses means using your CRM, job costing, scheduling, and customer data to make pricing, staffing, marketing, and growth decisions instead of gut feel. Most service businesses already have the data they need in their existing tools. The gap is knowing which metrics matter and how to connect them. When done right, it leads to higher margins, better capacity planning, and faster growth without adding headcount.
The Data You Already Have (But Probably Ignore)
Every service business runs on data. The problem is that data lives in separate tools that don't talk to each other.
Your CRM knows who called and what they asked about. Your scheduling tool knows when jobs ran and who showed up. Your accounting software knows what each job cost and what you billed. Your marketing platform knows which ads drove the calls.
Individually, each tool tells a partial story. Together, they tell you exactly where your business is making and losing money.
Most service business owners we talk to at AnovaGrowth can tell you their top-line revenue for last month. Fewer than half can tell you their profit margin by job type. Almost none can tell you which marketing channel produces the highest-margin customers.
That last metric is the one that actually matters.
The 5 Data Points That Drive Real Decisions
Not all data is equally useful. These five metrics, when tracked consistently, give you the highest leverage for decision making.
1. Cost Per Job by Type
Most service businesses know their average job cost. Few know how it varies by job type, season, or technician.
What to track: Labor hours, materials, travel time, and overhead allocated to each job category.
What it tells you: Which jobs are actually profitable and which ones are eating your margin. A plumbing company might discover that water heater replacements have a 40% margin while drain cleanings break even. That changes where you focus your marketing and how you price.
2. Lead Source to Close Rate
Tracking where leads come from is table stakes. Tracking which sources produce the highest close rate and the highest lifetime value is where the insight lives.
What to track: Source (Google Ads, referral, GBP, website form), close rate, average ticket, repeat rate.
What it tells you: Which channels to double down on and which to cut. A common pattern: Google Ads drives the most leads but referrals close at 3x the rate. The decision is not to cut ads but to understand the full funnel economics.
3. Capacity Utilization
This is the single most underused metric in service businesses.
What to track: Billable hours divided by available hours per tech, per week.
What it tells you: Whether you need to hire, whether you are overstaffed, and where scheduling inefficiencies live. A utilization rate below 60% means you have room to grow without adding headcount. Above 85% means you are leaving money on the table by not hiring.
4. Customer Lifetime Value by Segment
Not all customers are equal. Some book once and never return. Others become monthly maintenance clients and refer their neighbors.
What to track: Average revenue per customer over 12 months, segmented by service type, source, and location.
What it tells you: Where to invest retention effort and which customer types to prioritize. A landscaping company might find that commercial clients have 4x the lifetime value of residential. That changes how you structure your sales team.
5. Time from Lead to First Appointment
Speed is the hidden variable in service business revenue.
What to track: The time between when a lead first contacts you and when a job is booked.
What it tells you: Whether your intake process is costing you deals. Every hour of delay drops close rates. If your average is over 24 hours, you are losing business you already paid to acquire.
| Metric | Where the Data Lives | What It Reveals |
|---|---|---|
| Cost per job | Accounting + scheduling | Which services actually make money |
| Lead source to close | CRM + marketing | Where to spend ad dollars |
| Capacity utilization | Scheduling | When to hire or restructure |
| Customer lifetime value | CRM + accounting | Who to retain and upsell |
| Lead to appointment time | CRM + scheduling | Where your funnel leaks |
How to Connect Your Data Without a Data Team
The biggest barrier service businesses face is not collecting data. It is connecting data across tools. You do not need a data engineer to do this. You need three things:
A single source of truth for customer data. Your CRM should be the hub. Every other tool should feed into it or pull from it. If your scheduling tool does not sync with your CRM, fix that first.
Consistent job costing. Every job needs a cost code. Labor, materials, travel, overhead. If your technicians are not tracking time against jobs, you are flying blind on profitability.
A simple dashboard that shows the five metrics above. Not 50 metrics. Five. A dashboard that requires a data scientist to interpret will not get used. A dashboard that a service manager can glance at in 30 seconds will.
At AnovaGrowth, we have seen service businesses spend months building elaborate reporting systems that nobody uses. The ones that actually improve their margins start with one metric, fix it, then add the next.
Real Example: How One HVAC Company Used Data to Raise Prices 15% Without Losing Customers
An HVAC company in the Southeast came to us with a common problem. They felt like they were working harder and making less. Revenue was up year over year but margins were shrinking.
We helped them pull three data points:
-
Job cost by service type. They discovered that maintenance calls were profitable at their current pricing but emergency repair calls were losing money because of after-hours labor premiums they were not accounting for.
-
Customer retention by service type. Maintenance customers renewed at 80%. Emergency repair customers had a 20% repeat rate.
-
Price sensitivity by channel. Customers who came through Google Ads were 3x more likely to push back on price than referral customers.
The decision was clear. They raised emergency repair pricing by 15% to cover the real cost of after-hours labor. They invested more in their maintenance program because those customers were more profitable and more loyal. They stopped discounting for Google Ads leads and instead focused on faster response time as their differentiator.
Margins improved by 8 points in the first quarter. They lost some price-sensitive Google Ads leads but the ones who stayed had higher lifetime value.
This is not theory. This is what happens when you look at your actual data instead of guessing.
The Most Common Data Mistakes Service Businesses Make
Tracking everything. More data does not mean better decisions. If you are tracking 40 metrics, you are tracking none. Pick the five that matter for your business and ignore the rest until those are solid.
Using averages instead of segments. Average job cost hides the fact that some jobs are profitable and others are not. Average close rate hides the fact that referrals close at 80% and web forms close at 20%. Segment everything.
Making decisions on incomplete data. If your CRM does not capture lead source, you cannot know which marketing works. If your scheduling tool does not track travel time, you cannot know true job cost. Fix the data collection before you try to analyze.
Waiting for perfect data. The data you have today is good enough to make better decisions than the ones you are making on gut feel. Start with what you have and improve it over time.
How to Start Tomorrow Morning
You do not need a six-month data project. You need one hour and a spreadsheet.
- Pull your last 50 closed jobs from your CRM and accounting system.
- For each job, record: job type, labor hours, materials cost, total billed, lead source.
- Calculate margin per job and average by job type.
- Calculate close rate by lead source.
- Ask yourself: what would I do differently if I knew this information six months ago?
That exercise alone will surface at least one decision that improves your margins. From there, build the habit of reviewing these five metrics weekly. The data is already there. You just have to look.
Ready to turn your operations data into a growth advantage? Contact us to discuss how we can help you connect your tools and build a decision-making dashboard that actually gets used. Or read about custom analytics dashboards for service businesses and service business KPIs beyond revenue for more depth.
Related Questions
- How do I calculate true job cost when my techs do not track time?
- What is the minimum data I need before I can make data-driven pricing decisions?
- How do I get my team to actually use a new dashboard?
- Which CRM features matter most for data analysis?
- How often should I review my key business metrics?
- What is the fastest way to connect my scheduling tool to my CRM?
Related articles

Automation ROI Calculator for Service Businesses: Run the Numbers Before You Build
Most service businesses guess at automation ROI and get it wrong. This calculator framework gives you the three numbers that actually matter and shows you how to run them.
Read the article: Automation ROI Calculator for Service Businesses: Run the Numbers Before You Build
Service Business Weekly Operations Meeting: The 30-Minute Cadence That Keeps a Small Service Company on Track
A 30-minute weekly ops meeting turns scattered owner reactions into one predictable cadence. Most service companies under 50 people can run it themselves.
Read the article: Service Business Weekly Operations Meeting: The 30-Minute Cadence That Keeps a Small Service Company on Track
Service Business Year-End Planning Playbook: Q4 Tax Prep, Operations Tune-Up, and the Setup That Wins Q1
Most service businesses lose Q4 to last-minute scramble and limp into Q1 with bad books. A 90-day Q4 plan fixes tax, cash, hiring, and ops in one sweep.
Read the article: Service Business Year-End Planning Playbook: Q4 Tax Prep, Operations Tune-Up, and the Setup That Wins Q1
