The 48 Hours That Decide Whether a Complaint Becomes a Lawsuit
A homeowner calls your office at 9:14 AM. The water heater you installed three weeks ago is leaking through the ceiling. She is angry, scared, and stuck home from work. The phone rings to voicemail because the office manager is on another call. She leaves a 90-second message that nobody returns until 2:30 PM. By then, she has posted a 1-star Google review, sent a long email to your support inbox, and replied to your last invoice with a demand for a full refund.
That is not a customer service problem. That is a reputation problem dressed up as a customer service problem. The complaint itself was never the real issue. The slow response was.
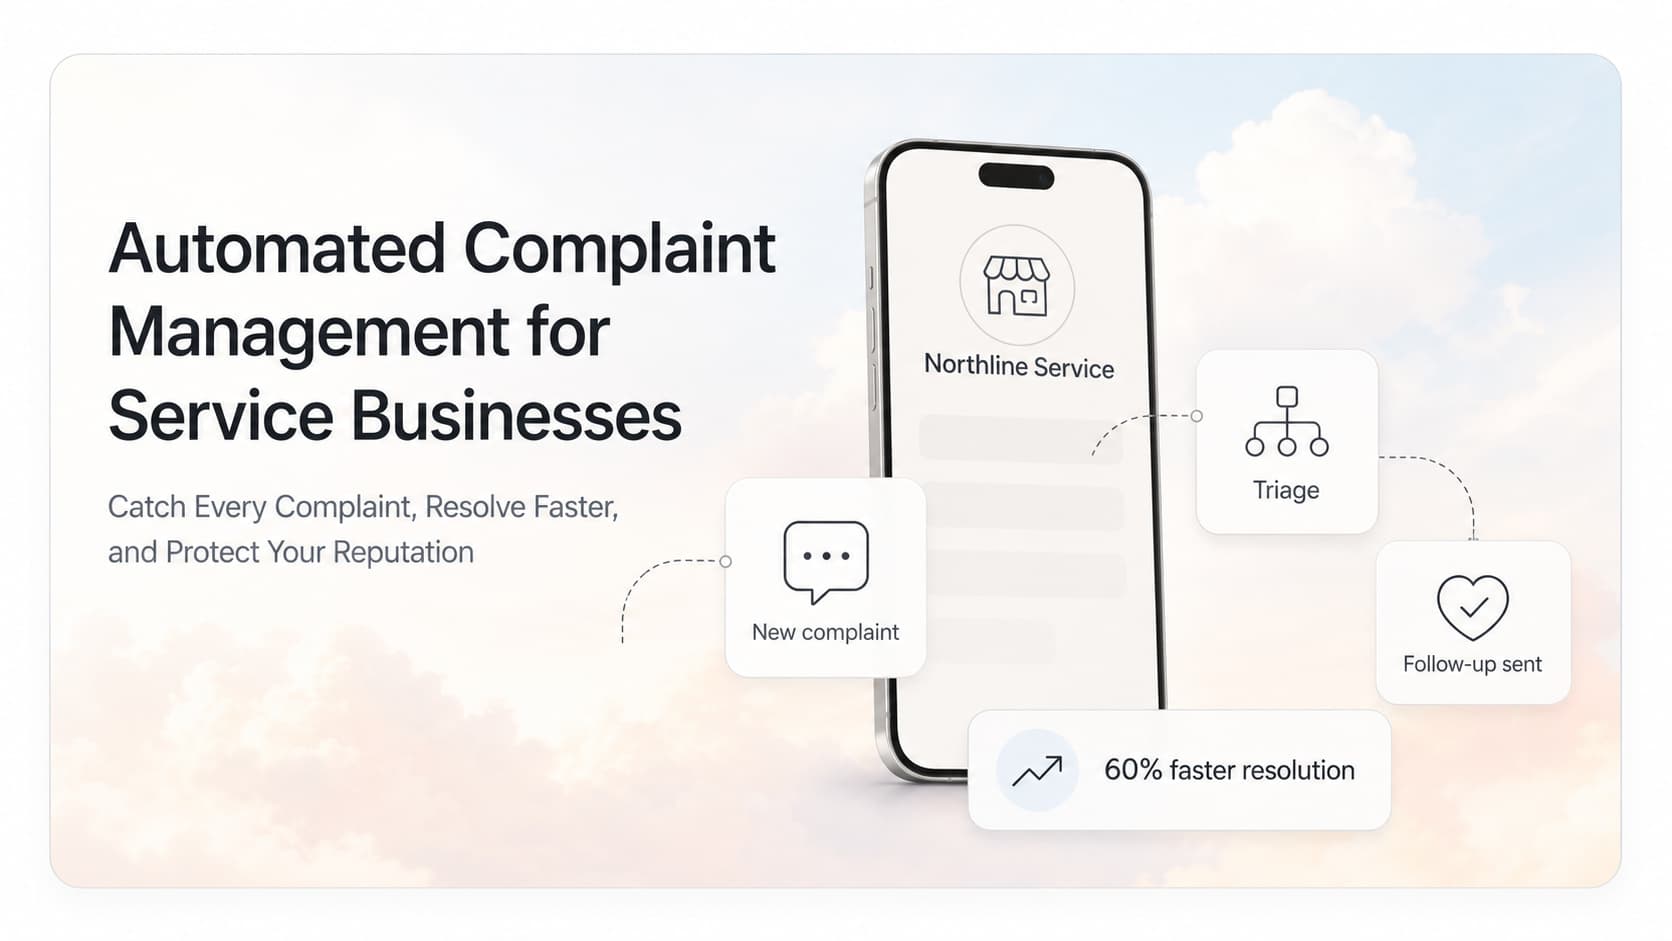
Quick answer: Automated complaint management uses a unified inbox, smart intake forms, severity tagging, and SLA-driven routing to catch complaints the moment they arrive, push the right one to the right person in minutes, and trigger a follow-up sequence that turns a 1-star review into a recovered customer. Service businesses that run a working complaint workflow resolve 60 to 80 percent of complaints within 24 hours, recover 30 to 50 percent of at-risk reviews, and avoid the slow-burn churn that comes from customers who felt ignored.
What an Unmanaged Complaint Actually Costs
Most service owners treat complaints as a nuisance. The math says they are a margin event, and almost every cost hides behind the visible one.
For a typical service business with $2.4M in annual revenue running 80 jobs per week:
| Cost Layer | Visible | Hidden |
|---|---|---|
| Refund or redo on the original job | Yes | $400-$2,200 |
| Crew time to redo the work | Yes | $250-$700 |
| Manager hours spent on calls and emails | Yes | 4-8 hours per complaint |
| Future revenue lost from the customer | No | $1,800-$6,400 over 5 years |
| Negative review impact on lead conversion | No | 5-12 lost jobs per year |
| Word of mouth damage in neighborhood | No | $8K-$25K per year for local trades |
| Insurance or legal exposure on bad cases | No | $5K-$50K per incident |
A single unmanaged complaint routinely costs a service business $3,000 to $15,000 once you add up the hidden layers. Multiply that by the 4 to 8 complaints a busy service business fields each month and you are looking at $150K to $600K in annual drag, much of it invisible on the income statement.
Where Complaints Actually Come From
Most service businesses think complaints come from the phone. In practice, the loudest complaints arrive through channels nobody is watching at 6 PM on a Tuesday.
The seven channels that catch the bulk of complaints:
- Inbound phone calls, both during business hours and after hours
- Email replies to invoices, estimates, and follow-ups
- Google Business Profile reviews (public and private feedback)
- Facebook and Instagram DMs, often from real customers mixed in with spam
- Text messages sent to the office line or to a tech's cell
- In-person complaints the tech hears and forgets to log
- Third-party review sites: Yelp, Angi, HomeAdvisor, Thumbtack, Nextdoor
The pattern we see in most AnovaGrowth audits: 70 percent of complaints arrive through 2 channels that get full attention, and the other 30 percent sit in inboxes nobody checks daily. By the time the team finds them, the customer has already written a review, told three neighbors, or filed a chargeback.
The Anatomy of a Modern Complaint Workflow
A complaint workflow that actually protects your reputation is not a shared inbox and a prayer. It is a layered system tuned to severity, response time, and channel. Here is the structure we use with most service clients.
Layer 1: Unified Intake Across Every Channel
The first job is making sure no complaint sits unread for more than 15 minutes. That requires a single inbox that pulls from every channel where a customer can reach you.
Tools that handle this well:
- A shared help desk (Front, Help Scout, Zendesk) wired to email, SMS, web chat, and social DMs
- A Google Business Profile API connection that polls for new reviews every 10 minutes
- A missed-call auto-text that says "Sorry we missed your call. Reply here and we will text you back in 5 minutes." This alone recovers 30 to 50 percent of voicemail complaints before they turn into bad reviews.
- A QR code on every invoice and tech's business card that links to a private complaint form (the form skips Google and gives the customer a direct line to your team)
The unified inbox is the most important piece. Without it, every other layer falls apart because half your complaints are sitting in a personal Gmail nobody monitors.
Layer 2: Severity Triage Within 5 Minutes
Every new ticket gets auto-tagged for severity based on keywords, dollar value, customer history, and channel. The tagging runs in your help desk or in a thin AI layer in front of it.
Sample severity rules:
- High severity: keywords like leak, fire, shock, smell, damage, lawsuit, refund, manager, attorney, insurance. Customer in active warranty period. Job value over $1,500. Repeat complaint from same customer.
- Medium severity: keywords like disappointed, unhappy, late, missed, dirty, rushed. First-time complaint under 30 days old. Job value between $300 and $1,500.
- Low severity: general feedback, tone complaints, scheduling friction, pricing questions without dispute language.
The tag drives routing. A high-severity complaint pings the owner's phone within 5 minutes. A medium complaint routes to the operations manager. A low complaint routes to the office admin with a 4-hour SLA.
Layer 3: SLA Timers and Escalation Rules
Every complaint carries an SLA based on severity. The system tracks time-in-queue and escalates automatically when an SLA is at risk of being missed.
Sample SLA matrix:
| Severity | First Response | Resolution Target | Escalation Path |
|---|---|---|---|
| High | 15 minutes | 4 hours | Owner phone + ops manager text |
| Medium | 1 hour | 24 hours | Ops manager email + Slack alert |
| Low | 4 hours | 72 hours | Office admin queue, daily digest |
The escalation fires when the timer hits 80 percent of the SLA. The owner does not need to watch a dashboard. The complaint finds them.
Layer 4: Resolution Templates With Personal Variables
Every severity level gets a small library of response templates. The templates are 80 percent written and 20 percent personalized by the responder.
High severity template (first response):
Hi [Name], this is [Owner Name] at [Business]. I just saw your message about [issue]. I am personally calling you in the next 15 minutes to talk through what happened and how we make this right. I am sorry you had to chase us down to get a response. That should not have happened.
The personalization is what makes it work. Customers can tell when a template is being used. They are far more forgiving when they can also tell a real human reviewed the details before sending.
Layer 5: Follow-Up Sequence After Resolution
A complaint is not closed when the customer stops responding. It is closed when you have confirmed the resolution actually solved the problem and you have asked for the review the customer would not have left otherwise.
The follow-up sequence runs 1 day, 7 days, and 30 days after resolution:
- Day 1: "Did the fix work? Anything else we need to address?"
- Day 7: "Just checking in. If you are happy, here is a direct link to leave us a Google review. If something is still wrong, hit reply and I will call you."
- Day 30: Net Promoter Score micro-survey for the complaint cohort
This is where most complaint workflows fail. The team closes the ticket in the help desk and moves on. The customer feels forgotten again. A 30-day follow-up converts 25 to 40 percent of at-risk reviewers into actual 5-star reviews.
The Numbers Behind a Working Workflow
The improvement shows up across the entire customer experience, not just in the complaint queue. A typical 90-day rollout at a service business:
| Metric | Before | After 90 Days |
|---|---|---|
| First response time | 6-18 hours | 8-22 minutes |
| Resolution time | 5-9 days | 18-36 hours |
| Complaints resolved within 24 hours | 22% | 78% |
| Repeat complaints from same customer | 31% | 6% |
| 1-star reviews per month | 4-7 | 0-2 |
| Reviews recovered from complainers | 8% | 34% |
| Owner hours on complaints per week | 9-12 | 2-3 |
| Staff morale score (1-10) | 5.4 | 8.1 |
The morale jump is not a typo. Teams that know the complaint will not sit in their queue for three days handle complaints calmly. Teams that dread the next escalation start to avoid customers. The workflow fixes both problems at once.
Building the Workflow in One Week
You can roll out a working complaint management workflow in five working days if you already have a CRM, a help desk tool, and a way to send SMS.
Day 1: Inventory the Channels
Open a spreadsheet. List every place a customer can currently reach you with a complaint. Mark which channel gets watched daily, which gets watched weekly, and which gets watched never. Most service businesses find 3 to 5 dead channels that account for a quarter of complaints.
Day 2: Stand Up the Unified Inbox
Pick one help desk (Front, Help Scout, or Zendesk are the usual suspects). Connect email, SMS, web chat, and the two social channels that matter most. Set up a Google Business Profile polling job for new reviews. Add a missed-call auto-text to your main line.
Day 3: Build the Severity Rules
Write the keyword list. Pull the last 30 real complaints from your email and phone logs. Tag each one manually. Look for the words and phrases that show up in every high-severity case. Build the rules around the patterns you actually see, not the patterns you assume you see.
Day 4: Wire the SLA Timers and Escalations
Configure the SLA matrix in your help desk. Set the escalation paths. Send a test high-severity complaint and watch it ping your phone inside 5 minutes. Send a test low-severity complaint and confirm it lands in the office admin queue with a 4-hour timer.
Day 5: Write the Templates and Turn It On
Write the three first-response templates (high, medium, low). Write the three follow-up templates. Personalize each one with the real names, job values, and customer details your system already has. Run a soft launch for one week before you turn on the public-facing complaint form.
What to Automate vs What to Keep Human
The complaint workflow has clear boundaries between what the system handles and what a human owns. Getting the split wrong is the single most common reason complaint programs fail.
Fully automate:
- Intake across all channels into the unified inbox
- Severity tagging based on the rules you have written
- SLA timer tracking and escalation triggers
- Routing to the right person based on severity, job type, or location
- First-response templates with personal variables filled in
- Day 1 and Day 7 follow-up messages
- Review request links after a positive Day 7 reply
AI drafts, human approves before send:
- Any response that includes a refund, discount, or credit
- Any response that mentions insurance, warranty terms, or legal language
- Any response to a customer who has threatened a lawyer, a chargeback, or a public review blast
- Day 30 survey responses that include new complaints hiding inside positive language
Always human, no automation:
- First contact on a high-severity complaint involving safety, property damage, or injury
- Any conversation where the customer is in tears, shouting, or visibly distressed
- Any conversation involving a competitor, a former employee, or a regulatory agency
- Final resolution messages on complaints that involve legal exposure
The split keeps the team fast on the volume and careful on the cases that matter. The system handles 70 to 80 percent of complaint volume on its own. The humans handle the 20 to 30 percent that actually need judgment.
Proof It Works: A 9-Tech Roofing Company in Atlanta
A residential roofing company with 9 field crews was averaging 11 complaints per month across 180 jobs. Average response time on the complaints was 14 hours. The owner was personally handling 4 of them every week, usually at 9 PM after the kids were in bed. Google reviews had stalled at 4.2 stars and were dropping quarter over quarter. Two competitors in the same market were running review-blast programs and pulling away.
The owner stood up a unified complaint inbox, severity tagging, and SLA escalation in 11 days. The first 90 days after go-live:
- First response time dropped from 14 hours to 11 minutes
- Resolution within 24 hours jumped from 18 percent to 81 percent
- 1-star Google reviews dropped from 6 per month to 1 per month
- 4 complaints were recovered into 5-star Google reviews by the same customer
- Owner hours on complaints dropped from 9 per week to 2.5 per week
- Google rating climbed from 4.2 to 4.7 stars
- Inbound lead volume from Google Business Profile rose 38 percent over the next 60 days
The team did not hire a customer service manager. The system ran on the existing office admin plus a part-time help desk seat. The owner got his evenings back. The reputation lifted on its own once the slow-response complaints stopped reaching Google.
How This Connects to the Rest of Your Operations
A complaint workflow is most powerful when it shares data with the systems around it. The complaint that surfaces a recurring problem is the same complaint that should trigger a change in your quoting, your hiring, your scheduling, or your tech training.
If your review pipeline is leaking, AI Reputation Monitoring and Review Response for Service Businesses covers the public-side fix that catches mentions before they go viral.
If you are losing customers after the first job, Automated Customer Retention for Service Businesses walks through the follow-up cadence that keeps complainers from churning after the resolution.
If your team needs a single place to track every customer touch, CRM Pipeline Management for Service Businesses covers how to wire complaints into the same view as leads, quotes, and renewals.
Related Questions and Subtopics
- What is the average complaint rate for service businesses? Industry benchmarks put it at 4 to 8 percent of completed jobs, with another 2 to 4 percent going unlogged through informal channels. Service businesses that automate intake typically discover 30 to 50 percent more complaints than they were seeing before, because the system catches what humans miss.
- What is the single biggest complaint driver for service businesses? Communication failure. Late arrivals, missed callbacks, and unclear scope account for roughly 60 percent of all complaints in service businesses. The work itself is rarely the issue. The silence around the work is.
- How fast should a service business respond to a complaint? First response within 15 minutes for high severity, 1 hour for medium, 4 hours for low. Resolution target of 4 hours for high, 24 hours for medium, 72 hours for low. Anything slower measurably increases the chance of a public 1-star review.
- Should complaints be public or private? Always give the customer a private channel first. A QR code on every invoice and tech business card that links to a private complaint form catches 25 to 40 percent of complaints before they hit Google. The customers who still go public after a private resolution are the ones to flag for follow-up.
- What is the best tool stack for complaint management? A help desk at the center (Front, Help Scout, or Zendesk), an AI layer for tagging and routing (a custom GPT, a Zapier filter, or a Make scenario), an SMS provider for outbound (Twilio or a CRM-native tool), and a Google Business Profile API for review polling. Total cost for a 10-person service business runs $200 to $600 per month.
- How do I recover a customer who already left a 1-star review? Respond publicly within 24 hours with a short, human apology and a private channel for resolution. Move the conversation to text or email. Resolve the issue. Ask the customer if they would consider updating the review once they feel whole. 15 to 25 percent of complainers will update or delete a 1-star review after a strong recovery.
AnovaGrowth Operating Insight
Most complaint workflows fail because the team treats them as a service project instead of an operations project. The real job is not to write better apology emails. The real job is to find the pattern in the complaint data and fix the upstream process that created it. We pull a complaint audit for every AnovaGrowth client at the 30-day mark. The patterns almost always show up in 3 to 5 places: a tech who is consistently late on a particular route, an estimator who is consistently underbidding a particular job type, a parts vendor who is consistently shipping the wrong SKU, a scheduling rule that double-books on Fridays. The complaint workflow surfaces those patterns within a month. The fix usually takes a quarter. That is how reputation scores actually move.
Key Takeaways
- Unmanaged complaints cost service businesses $3K to $15K each once you add up the hidden revenue and reputation drag
- A unified inbox, severity tagging, and SLA escalation are the three layers that turn a complaint queue into a reputation engine
- First response time under 15 minutes for high severity is the single biggest lever for stopping 1-star reviews
- 30-day follow-up converts 25 to 40 percent of at-risk reviewers into actual 5-star reviews
- Build the workflow in one week, automate 70 to 80 percent of volume, keep humans on safety, legal, and high-stakes cases
- One Atlanta roofing company lifted from 4.2 to 4.7 stars in 90 days without hiring a customer service manager
Next Steps
Pull the last 30 days of complaints from every channel your team uses. Email, phone log, text messages, Google reviews, social DMs. Put them in one spreadsheet. Tag each one for severity and resolution time. Multiply the count by $5,000. That number is the reputation drag you are carrying this quarter.
Then list the channels where customers can reach you and mark which ones get watched daily. Most service businesses find at least 3 dead channels.
If you want help building the unified complaint inbox, severity rules, and SLA escalations, wiring them into your CRM and Google Business Profile, and running the 30-day complaint audit that finds the upstream patterns, contact us for a 30-minute complaint workflow review. We will map your channels, draft the severity rules, and outline the integrations you need to lift your rating in the next 90 days.
Ready to turn complaints into recovered customers? Contact us and we will stand up the unified inbox, wire the severity rules, and build the follow-up sequence that turns a 1-star review into a 5-star relationship.