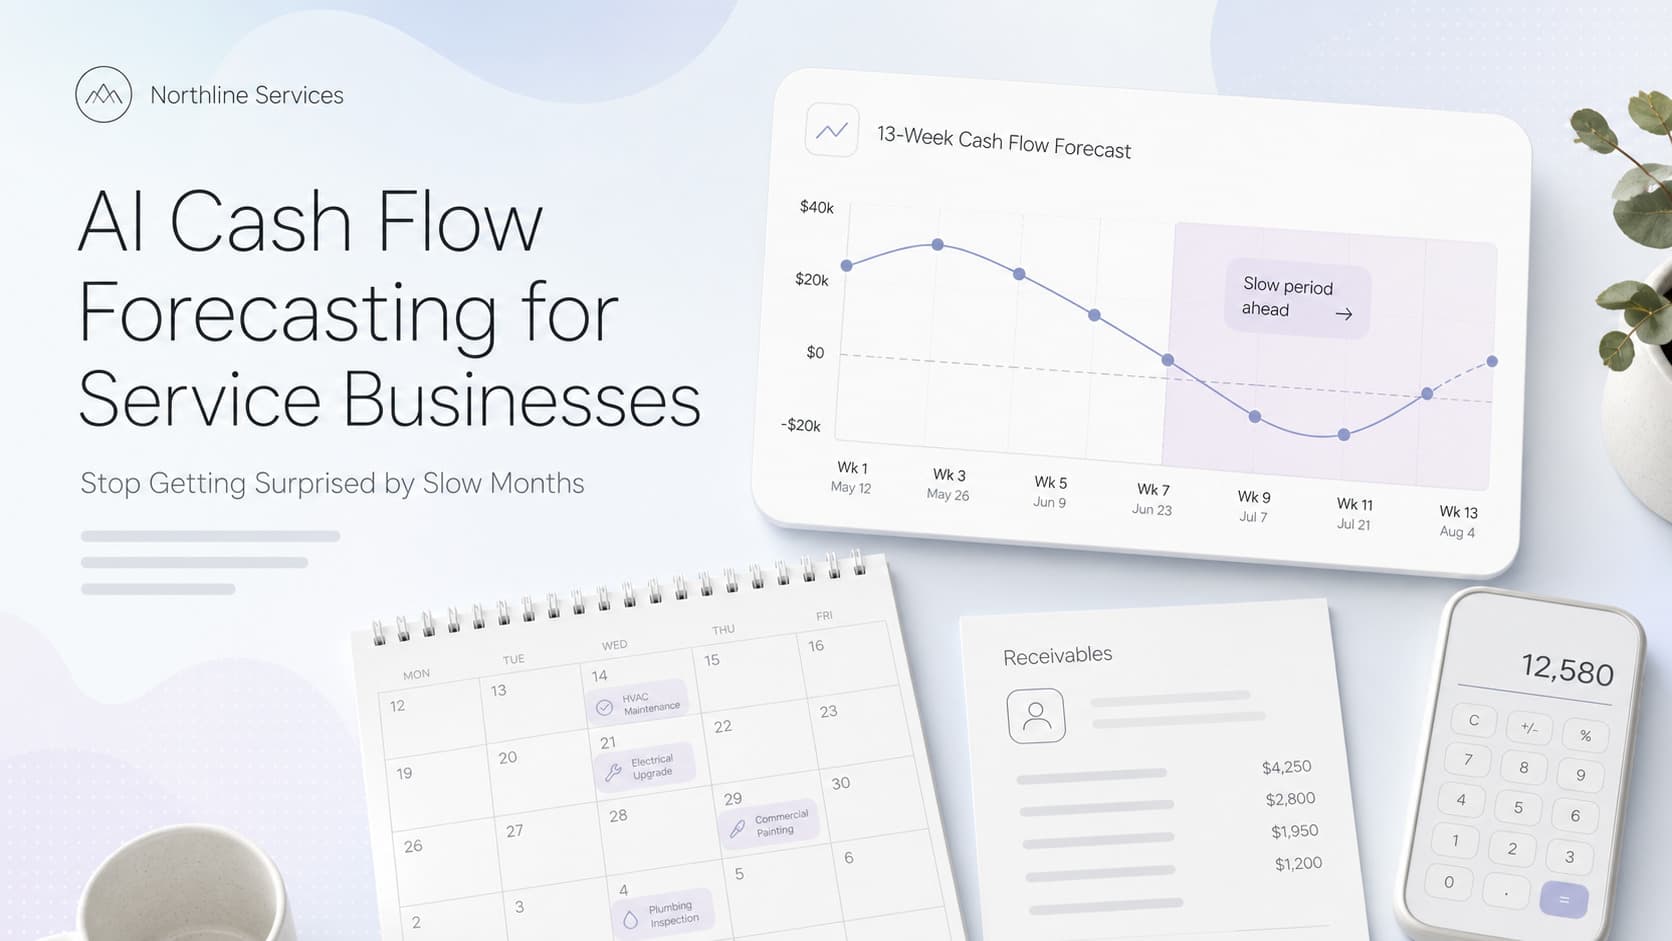
Quick answer: Cash flow forecasting for a service business is a 13-week rolling forecast built from four inputs you already have: current cash on hand, open invoices (AR), scheduled jobs in the next 90 days, and fixed weekly outflows (payroll, rent, materials, taxes). A simple weekly forecast predicts slow months 60-90 days out, tells you when to delay a hire, accelerate collections, or hold a purchase. AI makes the forecast live by pulling the inputs automatically and flagging anomalies (job cancelled, customer paying late, payroll climbing). Most service businesses can build the first version in an afternoon with QuickBooks, a Google Sheet, and the dispatch board. The discipline that matters is the weekly update, not the math.
The Cash Surprise No Service Business Owner Wants
Last March, the owner of a 22-person HVAC company in the Southeast sat across from his controller and asked why the company had bounced two payroll checks. The controller pulled up QuickBooks. Revenue was fine. YTD was up 14%. Profit was up. The problem was timing. Three large commercial jobs that had been verbally approved in January had not been invoiced. A payment to a parts supplier had been delayed past net 30. Payroll for the previous week had cleared while the new deposits had not.
The owner had the revenue. He did not have the cash. The bank account did not care about YTD profit. It cared about what cleared on Tuesday.
This is not a bad-business problem. It is a cash visibility problem. Most service businesses run on a P&L that tells them what happened last month and an income statement that hides the timing. By the time the owner sees the gap, the only option is expensive: a line of credit draw, an emergency collection call, a delayed payroll that damages trust.
A 13-week cash flow forecast prevents the surprise. It shows you the next 90 days in weekly buckets, flags the dips before they hit, and gives you 4-8 weeks to act on the gap.
Why Service Businesses Get Blindsided
Three structural reasons keep service business owners in the dark about cash.
Revenue is lumpy, expenses are fixed. A plumbing company might book 18 service calls in week one of the month and 7 in week three. Payroll still hits every Friday. Rent still hits on the first. Materials for the big job hit in week two. The cash in and cash out curves look nothing like the revenue curve.
Invoices are slow to convert. Most service businesses invoice on net 30 and collect on net 47. Commercial jobs can be net 60. The gap between "job done" and "cash in the bank" is the longest and most variable line in the forecast. AR is the single biggest swing factor in service business cash flow.
Decisions are made on stale data. The owner makes the hiring decision in week one. The payroll impact shows up in week three. The cash strain shows up in week six. By the time the bank balance tells the owner there is a problem, the hiring decision is already a sunk cost.
Cash flow forecasting fixes all three. It moves the lens from monthly P&L to weekly cash, exposes the timing of receivables, and gives the owner 4-12 weeks of lead time on the gap.
What a Cash Flow Forecast Actually Is
A cash flow forecast is not a budget. A budget is what you hope will happen. A forecast is what the data says will happen, with probabilities. The forecast has four inputs.
| Input | Source | Updates |
|---|---|---|
| Starting cash on hand | Bank account, refreshed weekly | Weekly |
| Expected receivables (AR) | Open invoices by due date, weighted by historical collection rate | Weekly |
| Expected revenue from scheduled jobs | Dispatch board, weighted by job close probability | Weekly |
| Fixed weekly outflows | Payroll, rent, loan payments, insurance, taxes | Monthly |
The output is a single line per week for 13 weeks showing opening cash, expected cash in, expected cash out, and closing cash. The forecast rolls forward every week. As next week becomes this week, the actual cash replaces the forecast, and a new week 13 gets added.
The numbers that matter are not the totals. They are the dips. A forecast that shows closing cash dropping from $240K to $85K in week 9 is the trigger to act. A forecast that shows closing cash steady at $200K is the green light to hire.
The 13-Week Rolling Forecast Format
The 13-week rolling forecast is the standard format for service businesses because it covers one full quarter plus a month of overlap. Long enough to plan a hire. Short enough to keep accurate.
Each week has the same structure:
| Line | Description | Source |
|---|---|---|
| Opening cash | Cash balance from end of previous week | Bank |
| Cash in: AR collections | Open invoices by week, weighted by probability | AR aging report |
| Cash in: New job revenue | Scheduled jobs by week, weighted by close probability | Dispatch board |
| Cash in: Other | Loans, owner contributions, tax refunds | Bank |
| Cash out: Payroll | Weekly or biweekly, fixed | Payroll provider |
| Cash out: Materials | Materials tied to scheduled jobs | Job costing |
| Cash out: Subs and vendors | Open POs, recurring bills | AP aging report |
| Cash out: Fixed | Rent, insurance, loan payments, taxes, software | AP schedule |
| Cash out: Owner draw | Fixed weekly draw or distribution | Owner |
| Net cash flow | In minus out | Calculation |
| Closing cash | Opening plus net cash flow | Calculation |
The forecast is a single spreadsheet. Most service businesses can build the template in an afternoon. The hard part is keeping it current.
How to Predict Slow Months 60-90 Days Out
A 13-week forecast does not predict slow months by itself. It surfaces them. The predictions come from three signals.
Signal 1: AR Aging Distribution
Look at the AR aging report and ask: what percentage of receivables is in the 60-90 day bucket? Service businesses with healthy AR have less than 10% over 60 days. Service businesses with stressed AR have 20-40% over 60 days. A growing 60-90 bucket means cash 30-60 days from now will be lower than today.
Signal 2: Scheduled Job Density
Look at the dispatch board 60-90 days out. Are those weeks fully booked, half booked, or empty? A fully booked July in HVAC looks great on paper, but if July is 14 weeks away and the board is empty, the forecast for week 14 is the gap. Service businesses in seasonal markets (HVAC, landscaping, pool service, roofing) see this signal clearly.
Signal 3: Contract Renewal Calendar
Service businesses with recurring revenue (maintenance contracts, service agreements, recurring cleaning) need a renewal calendar 60-120 days out. A quarter where 25% of contracts expire is a slow collection quarter 60-90 days later. The renewal calendar is the leading indicator.
The Decisions the Forecast Enables
A forecast without a decision is just a spreadsheet. The forecast earns its keep when it changes a decision.
| Forecast Signal | Default Decision | Better Decision |
|---|---|---|
| Closing cash drops below 1.5x monthly payroll | Hold off on the new hire | Hire only if closing cash stays above 2x monthly payroll for 4 weeks |
| AR aging grows above 15% in 60+ bucket | Wait for customers to pay | Call customers in the 30-day bucket, offer 2% early-pay discount, accelerate collection |
| Week 11-13 booking density drops below 60% | Hope next month picks up | Run a 30-day promo to fill the gap, or schedule a maintenance blitz for the slow weeks |
| Materials cost spike forecast in week 8 | Order when needed | Pre-buy materials at week 6 if cash is available, or delay non-critical jobs |
| Owner draw exceeds forecast closing cash | Take the draw anyway | Reduce the draw for the slow weeks, replenish in the strong weeks |
Each of these is a decision the owner is making today, blind. The forecast just makes the decision visible.
How AI Makes the Forecast Live
The spreadsheet forecast is the foundation. AI makes it useful.
Three AI capabilities move a cash flow forecast from a weekly chore to a live operating tool.
Automated data pull. The forecast loses value the moment it goes stale. AI agents pull the four inputs every Monday morning: bank balance from the bank API, AR aging from QuickBooks, scheduled jobs from the dispatch board, and fixed outflows from the payroll and AP systems. The owner opens the forecast Monday at 9 AM and the numbers are already current.
Anomaly flagging. AI watches the forecast for signals a human would miss. A 35% drop in scheduled jobs week 11. A customer whose payment is 14 days past due with no response. A new vendor with a 90-day payment term. AI flags each anomaly in plain English in the Monday report. The owner reads the flags, not the spreadsheet.
Scenario modeling. AI runs three scenarios every week: best case (all AR collects on time, all scheduled jobs close), expected case (AR collects at historical rate, jobs close at historical rate), worst case (AR stalls 14 days, 30% of scheduled jobs slip). The three scenarios give the owner a range, not a single number, and the decision shifts from "what will happen" to "what could happen."
A live forecast with anomaly flagging and scenario modeling turns cash flow from a monthly surprise into a weekly conversation.
Operating Insight: The Weekly 30-Minute Cash Review
The biggest mistake we see with cash flow forecasting is treating it as a monthly project. The teams that get the most value from the forecast run a 30-minute weekly cash review every Monday morning. The agenda is fixed:
- Read the closing cash line for weeks 1-4. Anything below 1.5x monthly payroll is a flag.
- Read the closing cash line for weeks 5-13. Anything trending down is a signal.
- Walk through the anomaly list the AI flagged. Decide on a response for each.
- Decide one decision: hire, delay hire, accelerate AR, hold AP, reduce owner draw.
The 30 minutes a week is the entire operating rhythm. The owner walks in with a stale view of cash and walks out with a current view and one decision. The discipline matters more than the model.
In one home services client, the Monday cash review became the meeting that replaced the monthly P&L review. The owner stopped looking at last month's numbers and started looking at next month's numbers. The first 90 days of the rhythm surfaced three slow months the owner had not seen coming and gave the team 6-8 weeks to act on each. AR collection improved by 18%. Owner draws got smoother. The line of credit sat unused.
Common Mistakes to Avoid
Forecasting revenue instead of cash. Revenue is what you invoice. Cash is what clears. They are not the same number for 30-90 days. The forecast is cash, not revenue.
Assuming all AR collects on time. Service businesses that invoice net 30 collect on net 47 on average. Build the AR line at 75% probability of collection in the due week, 20% the week after, 5% the week after that. The aggregate forecast is more accurate than the optimistic version.
Ignoring seasonal cash drains. Quarterly taxes hit 4 times a year. Insurance renews once. Material bulk buys happen twice. The forecast has to include the known spikes, not just the steady state.
Updating monthly instead of weekly. A monthly update gives you 4 weeks of stale data before you see the dip. A weekly update keeps the forecast within 7 days of reality. The owner is acting on the forecast, not admiring it.
Skipping the worst case. The expected case is what usually happens. The worst case is what you plan against. If the worst case shows closing cash below 0.5x payroll, that is the line that drives the decision.
Letting the owner draw float. Owner draws that flex with cash flow instead of being fixed create an unstable forecast. Set a fixed weekly draw, plan around it, and let the company build the cash buffer.
What This Connects to Your Other Systems
The forecast is most powerful when it shares data with the systems around it.
If AR collection is the biggest swing factor in the forecast, Automated Payment Plans for Service Businesses and Payment Follow-Up Automation for Service Businesses cover the workflows that speed up collection without the awkward phone calls.
If scheduled job density is the leading indicator, Automated Lead Nurturing for Service Businesses covers the campaign that fills the slow weeks before they hit.
If the forecast is flagging materials cost spikes, Automated Inventory Management for Service Businesses covers the reorder points and vendor terms that smooth the spend.
If the owner is making the hiring decision blind, Service Business KPIs Beyond Revenue covers the operating metrics that justify the hire before the cash strain hits.
If the cash strain is showing up as a billing problem, Automated Estimating and Invoicing for Service Businesses covers the invoice-to-cash flow that tightens the collection cycle.
Related Questions and Subtopics
- What is cash flow forecasting for a service business? It is a 13-week rolling forecast built from current cash, AR, scheduled jobs, and fixed weekly outflows. The forecast predicts closing cash for each of the next 13 weeks and surfaces slow months 60-90 days before they hit.
- How often should I update a cash flow forecast? Weekly. Monthly is too stale to act on. The refresh takes 15-30 minutes if the inputs are pulled automatically, longer if the owner is pulling them manually.
- What is the best cash flow forecast format for a small service business? The 13-week rolling forecast. Long enough to plan a hire or a major purchase. Short enough to keep accurate. The forecast rolls forward every week so week 13 becomes a new week 1.
- What is the difference between cash flow forecasting and budgeting? A budget is what you hope will happen over a year. A forecast is what the data says will happen over the next 13 weeks. The budget drives planning. The forecast drives weekly decisions. Service businesses need both.
- How do I predict slow months 60-90 days out? Three signals: AR aging distribution, scheduled job density on the dispatch board 60-90 days out, and contract renewal calendar. A growing 60+ AR bucket, an empty dispatch board at week 11, or a heavy renewal quarter are the leading indicators.
- Can AI really forecast cash flow? Yes, for the inputs you already have. AI pulls AR, scheduled jobs, and fixed outflows automatically, flags anomalies, and runs three scenarios (best, expected, worst). The math is simple. The discipline and data plumbing are the hard parts.
- What is a healthy cash buffer for a service business? Most service businesses target 2-3x monthly fixed outflows in cash on hand at all times. Below 1.5x monthly fixed outflows is a yellow flag. Below 1x is a red flag that triggers a hiring freeze, draw reduction, or collection push.
- How do I start a cash flow forecast without QuickBooks or a CRM? Start with a Google Sheet. Pull bank balance weekly, list open invoices by due date, list known outflows by week. The first version takes an afternoon. The discipline of updating it weekly takes longer to build than the spreadsheet.
- How do I get the team to actually use the forecast? Tie the forecast to a Monday morning 30-minute review. The owner reviews the closing cash line for the next 13 weeks. The team decides one decision: hire, delay hire, accelerate AR, hold AP, or reduce draw. The forecast is a meeting agenda, not a dashboard.
- What is the biggest cash flow mistake service businesses make? Confusing revenue with cash. A profitable service business can run out of cash. Revenue hits the P&L when the job is done. Cash hits the bank 30-60 days later. The forecast has to be cash, not revenue.
Key Takeaways
- Cash flow forecasting is a 13-week rolling forecast built from cash on hand, AR, scheduled jobs, and fixed weekly outflows.
- Revenue is not cash. The forecast is cash, not P&L. Most service businesses confuse the two and get blindsided.
- AR aging distribution, scheduled job density, and contract renewal calendar are the three leading indicators of slow months.
- The forecast earns its keep when it changes a decision: hire, delay hire, accelerate AR, hold AP, or reduce draw.
- AI makes the forecast live by pulling inputs automatically, flagging anomalies, and running three scenarios weekly.
- The 30-minute Monday cash review is the operating rhythm. The forecast is a meeting agenda, not a dashboard.
- A healthy cash buffer is 2-3x monthly fixed outflows. Below 1.5x is yellow. Below 1x is red.
- Update weekly. Monthly updates give you 4 weeks of stale data before you see the dip.
- Plan against the worst case, not the expected case. The expected case is what usually happens. The worst case is what you build the buffer for.
- The forecast is most powerful when it shares data with AR, scheduling, and AP. Silos make the forecast stale.
Next Steps
The fastest way to start is to open a Google Sheet, list the next 13 weeks down the left column, and add five lines per week: opening cash, AR expected, scheduled job revenue, fixed outflows, closing cash. Pull the AR from QuickBooks. Pull the scheduled jobs from the dispatch board. Set a Monday reminder to refresh the numbers and review the closing cash line for weeks 5-13. After 4 weeks of weekly updates, the dips will start to show up before they hit the bank.
If you want help wiring the forecast into your CRM, dispatch board, and accounting platform, setting up the AI agent that pulls the four inputs every Monday, and building the anomaly list and scenario model that turns the forecast into a weekly operating tool, contact us for a 30-minute cash flow review. We will audit your current cash visibility, draft the 13-week forecast template for your business, and outline the automation you need to predict slow months 60-90 days out.
Ready to stop getting surprised by slow months? Contact us and we will build the 13-week forecast, the AI data pull, and the Monday cash review that turns your bank balance into a forecast you can act on.