Quick Answer
AI tech skill matching scores every available technician against every open job on skills, certifications, parts on truck, past performance, proximity, and time of day, then recommends the assignment most likely to close the job on the first visit. For service businesses running 5 to 50 trucks, this is the highest-value place to put AI in operations. Most companies we work with raise first-time fix rate 8 to 15 points and cut callbacks 30 to 50 percent within 90 days.
Why First-Time Fix Rate Is the Most Important Field Service KPI
First-time fix rate is the percentage of service visits that resolve the customer's problem in a single trip, with no follow-up visit, no callback, and no escalation. When that number goes up, four other numbers move with it: revenue per tech per day goes up, customer retention goes up, callback cost goes down, and the Google review average drifts upward because the same tech handles the same problem again and again. When it goes down, the opposite happens, slowly enough that most operators do not catch it until the quarter is over.
The reason it gets ignored is that it does not show up on a P&L. There is no line item for "tech sent without the right part, customer had to take another day off work, customer left a 3-star review, customer churned in 14 months." Each of those outcomes is a small cost in a different system. Lumped together, they are typically the single biggest controllable expense in a field service business after labor.
We worked with a 14-truck HVAC company in the Southeast last year. Their first-time fix rate was 71 percent on completion data, meaning roughly 29 out of every 100 jobs required a return trip, a different tech, or an outside vendor. We asked the owner what that cost him. He guessed "maybe a couple hundred thousand a year in extra dispatch." We built the actual model. The real cost was north of $1.4 million annually, when you counted the second truck roll, the lost productivity on the rescheduled day, the customer service time on the phone, the warranty credits, the lost referral value, and the churned customers who quietly stopped calling. He had no idea. Almost no service business owner does.
The fix is to stop treating tech assignment as a routing problem. Routing matters, and the automated dispatch guide covers it. But the bigger lever is matching the right tech to the right job, and most dispatch software does this badly. The dispatcher makes a judgment call based on who is closest, who has a free hour, and who complained about a similar job last week. That is not a strategy. It is a coin flip with bad data.
What First-Time Fix Rate Actually Measures
There are three flavors of "fix" that get confused in practice, and each one is measured differently:
| Metric | What It Counts | Why It Matters |
|---|---|---|
| First-time fix rate (FTFR) | Visits where the customer's stated problem was resolved and no follow-up was scheduled | The cleanest measure of tech effectiveness and dispatch quality |
| Callback rate | Visits that resulted in a customer-initiated return trip within 30 days | A measure of customer dissatisfaction and rework, sensitive to soft factors |
| Repeat visit rate | Total follow-up visits divided by total completed visits | A broader measure that includes warranty work, planned second visits, and escalations |
A 90 percent FTFR with a 4 percent callback rate and an 8 percent planned second-visit rate is a healthy operation. A 90 percent FTFR with a 12 percent callback rate is a sign that the "fixed" visits were not actually fixed, only marked complete in the system.
The metric that drives profitability is FTFR, because every callback costs the company twice. The first visit is a write-off, and the second visit is a discounted truck roll you have to eat to keep the customer from leaving. Aim for FTFR as your primary metric, with callback rate as the honesty check.
The Hidden Inputs to First-Time Fix Rate
Most owners blame "the tech" when FTFR drops. The actual causes are usually upstream:
- Intake quality. If the call-taker does not capture the model number, the error code, or the symptoms, the tech arrives guessing. Guessing produces a callback.
- Truck stock. If the right part is not on the truck, the tech cannot close the job even if they diagnose it perfectly on the first visit. Truck stock is its own AI problem, covered in the truck stock optimization guide.
- Tech assignment. If the dispatcher sends a tech who has never seen that equipment brand, the diagnosis takes longer and the chance of a clean fix drops. This is the lever we are focusing on here.
- Tech knowledge. If the tech cannot remember the procedure for a specific error code, they default to "replace the part" instead of "reset the sensor." An AI knowledge base closes this gap at the moment of need.
- Customer expectations. If the customer thinks the visit is a quote when it is a repair, no fix will satisfy them. This shows up as a callback with a complaint, not a true repeat visit.
Improving FTFR by 10 points usually means fixing three or four of these at once. Tech assignment is the highest-value of the five because it does not require a behavior change from customers or techs, only a better decision upstream.
The Skill Match Score: Inputs, Weights, and Threshold
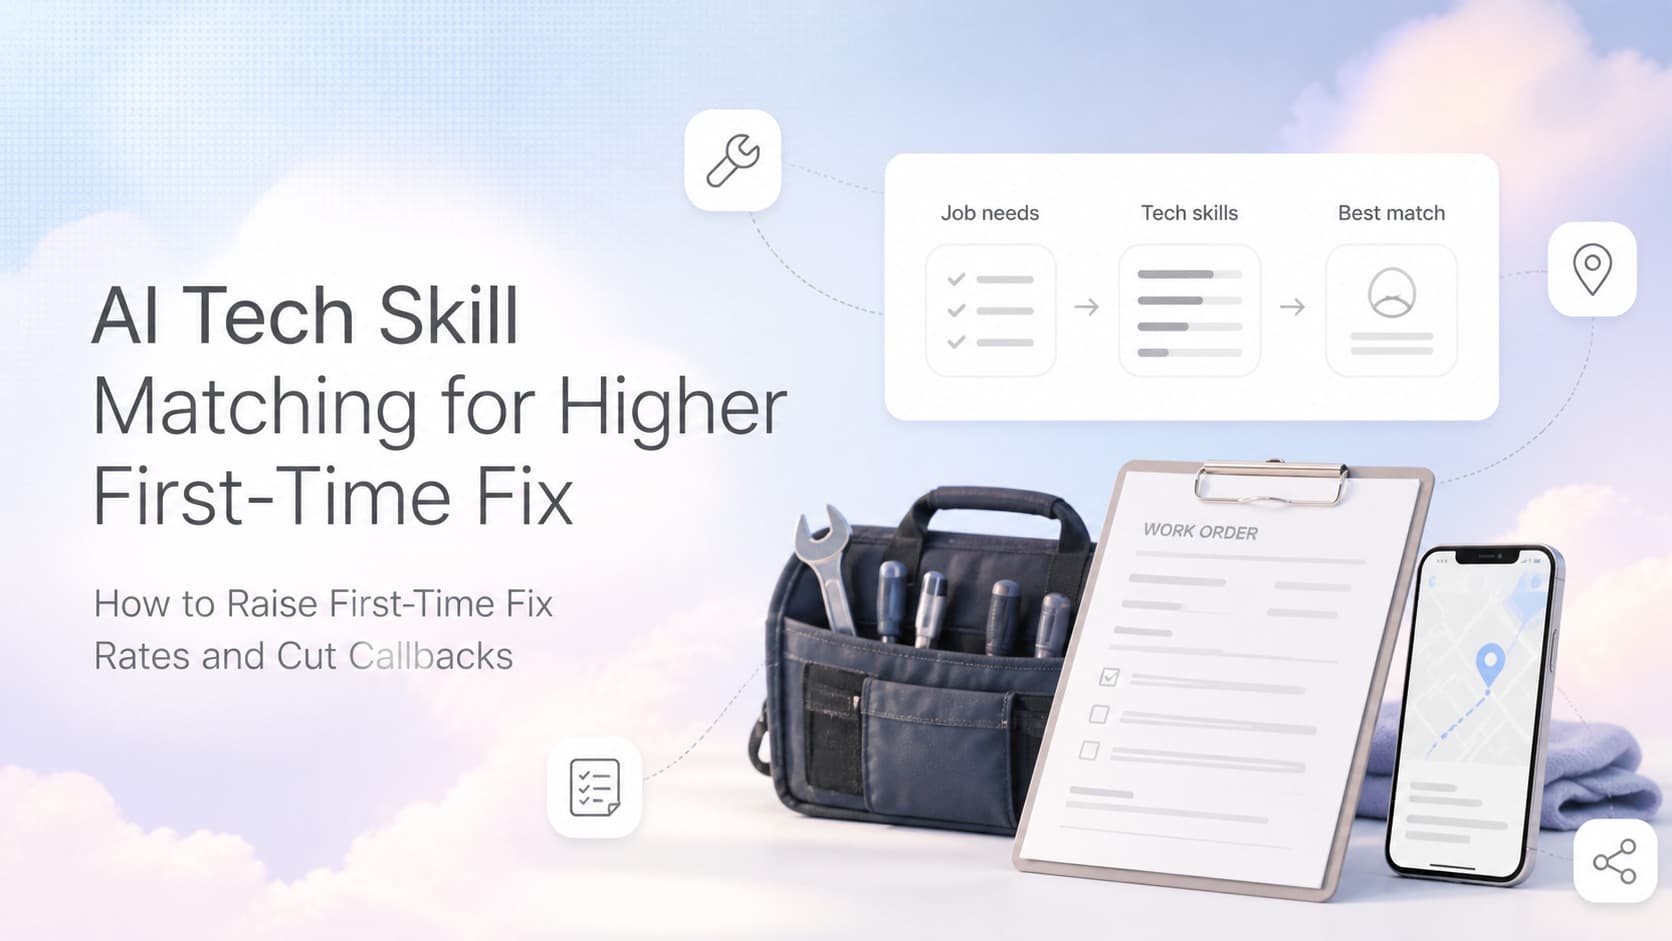
The core of AI tech matching is a score that runs every time a job opens and every time a tech becomes available. The score is a weighted sum across five to seven inputs. For a 14-truck HVAC and plumbing operation we built this for, the score looked like this:
| Input | Weight | What It Measures |
|---|---|---|
| Skill match | 35% | Has the tech completed 25+ jobs of this exact equipment family in the last 12 months? |
| Certification match | 15% | Does the tech hold the manufacturer certification or code license required for this work? |
| Historical FTFR on similar jobs | 20% | What is the tech's first-time fix rate on jobs of this category over the last 90 days? |
| Parts on truck match | 15% | Does the tech's truck stock include the parts most likely to be needed, based on the symptom? |
| Proximity and route fit | 10% | Will the tech's current route accommodate this job without a 30-minute detour? |
| Time of day and energy | 5% | Is this tech in the first or last four hours of the shift, and how does that affect diagnosis quality? |
The weights are not magic. They are a starting point based on what the data showed mattered most. After 60 to 90 days of shadow mode, the weights are re-tuned using the actual outcomes. The skill match weight is the one that almost always ends up as the dominant factor, usually 30 to 40 percent of the score.
The threshold question is the one operators care about most: what score is "good enough" to assign without review? The answer depends on job complexity and risk. For a $180 drain clear, a score of 60 is fine. For a $4,000 boiler replacement, a score of 85 with a required certification match is the floor. The system can be configured per job type.
What the Score Is Not
The skill match score is not a ranking of techs by quality. It is a fit score between a specific tech and a specific job. The best tech in the company might score 45 on a job they have never done before, and a less experienced tech might score 92 on a job they have done 80 times. The right tech for the right job is what matters, not the right tech overall.
This is the part that changes the most behavior. Once dispatchers see that the system is recommending techs they would not have picked, and that the recommendations consistently produce higher FTFR, the dispatchers stop overriding. Within 90 days, override rates drop from 30 to 40 percent of assignments to under 10 percent. That is when the lift starts to compound.
How To Build the Matching Engine
The build is not complicated. For a service business with 5 to 50 trucks, the matching engine has five pieces, in order of build priority:
- Tech profile data. Skills, certifications, hire date, equipment families they have worked on, recent FTFR by job category. Pull from the CRM, the HR system, and the dispatch board. Most of this data exists but is fragmented.
- Job profile data. Equipment type, problem category, parts likely needed, customer history, complexity rating. Pull from the job intake form and the work order template.
- Historical job outcomes. A table that joins tech ID to job ID to outcome (first-time fix, callback, escalated, abandoned). You need at least 6 months of this data for the model to be useful.
- Scoring logic. The weighted score above, run as a real-time calculation any time a job opens or a tech becomes available. This can be done in a spreadsheet for under 20 techs, in Airtable or a no-code tool for 20 to 50 techs, or as a small custom model for larger fleets.
- Recommendation workflow. A push notification, a board update, or an inbox card that shows the dispatcher the top 3 matches with the score breakdown, and the recommended choice.
The whole thing takes 4 to 6 weeks to build for a typical service business. Most of the time goes into data cleanup. The math is straightforward once the data is right.
A 14-Truck HVAC Example
One of our clients runs 14 trucks across two counties in the Southeast. Before the matching engine, the dispatcher assigned jobs by who was closest and who was available. FTFR was 71 percent, callback rate was 18 percent, and average jobs per tech per day was 4.2.
We built the scoring model using 14 months of job outcome data. The top three predictors of first-time fix were, in order: tech's history with the specific equipment family (37 percent weight), tech's 90-day FTFR on similar jobs (22 percent), and parts on truck match (17 percent). Proximity ended up at 8 percent, much lower than the dispatcher assumed.
After 90 days of using the recommendation, FTFR was 84 percent. Callback rate dropped to 11 percent. Jobs per tech per day climbed to 5.1. The owner calculated the lift at $740,000 in annual gross profit from the same trucks, same techs, same marketing budget. The system cost $14,000 to build and runs on a stack they already owned.
For more on the operational data layer that powers models like this, the CRM integration guide walks through the architecture.
How the Assignment Workflow Changes Day to Day
The matching engine is only useful if it changes what dispatchers actually do. The pattern we have seen work, in order of rollout:
Stage 1: Shadow Mode (Weeks 1 to 4)
The system runs in the background. Every job gets a score and a recommended tech. Dispatchers continue to assign as they always have. At the end of each week, the dispatcher sees a comparison: their assignment versus the system's recommendation, and the FTFR outcome on each. The point is to build trust in the model without forcing a behavior change.
Stage 2: Suggest With Reason (Weeks 5 to 8)
The system surfaces the recommendation at the moment of assignment, with the score breakdown. Dispatchers are expected to follow the recommendation unless they have a specific reason not to, in which case they override with a one-line note. Override rates in this stage typically run 20 to 30 percent, almost always on jobs with unusual context the model has not seen before.
Stage 3: Auto-Assign With Guardrails (Weeks 9+)
The system assigns automatically when the top score is above a per-job-type threshold and no override reason is provided. Dispatchers can still re-route when something changes, but the default is the model's choice. This is where override rates drop to under 10 percent and FTFR keeps climbing.
Guardrails matter in stage 3. The system should never auto-assign if the job requires a certification the recommended tech does not have. It should never auto-assign if the recommended tech has flagged fatigue, is on a probationary status, or is more than 60 minutes away when a closer qualified tech is available. The guardrails are simple rules, not model logic. They exist so the auto-assign feature can be trusted.
Where AI Tech Matching Fits in the Larger Automation Stack
Tech matching is one of three field service automations that compound when they are deployed together. The other two are truck stock optimization and AI knowledge base access. The three reinforce each other in a way that is hard to replicate with any single one.
Truck stock optimization ensures the right tech has the right parts on the truck. Without it, the tech matches the job perfectly but cannot close it because they are missing a $14 capacitor.
AI knowledge base access ensures the right tech can troubleshoot unfamiliar equipment at the moment of need. Without it, the tech matches the job perfectly but takes twice as long because they have to call the office for procedure help.
Tech skill matching ensures the right tech is dispatched to the right job in the first place. Without it, the other two systems are still saving the day for techs who were the wrong person for the job.
The combined effect of all three is well documented. Service businesses that run all three typically see 20 to 35 percent more jobs per tech per day, 40 to 60 percent fewer callbacks, and 15 to 25 percent higher customer retention within 12 months. The systems are individually cheap. Together they are a serious competitive moat.
For the broader picture of how field service automation fits into the operations stack, the field service automation guide covers the full architecture. For the AI workflow observability layer that catches broken automation before customers do, the observability guide is the adjacent read.
Decision Table: Where To Start With AI Tech Matching
| Starting Point | First Move | Time To First Lift |
|---|---|---|
| You have 5+ trucks and 6+ months of job history in your CRM or FSM | Pull the data, build the score, run in shadow mode for 4 weeks | 4 to 6 weeks to first measurable FTFR lift |
| You have trucks but less than 6 months of clean history | Start logging the inputs now (skills, certifications, parts on truck), run the model once you cross 6 months | 6 to 9 months |
| You run under 5 trucks | Skip the model, build a simple two-column scorecard (skill match yes/no, certification match yes/no) and use it manually | 1 to 2 weeks |
| You already use ServiceTitan, Housecall Pro, or Jobber | Most modern FSMs have a skill match feature. Turn it on, audit the recommendations, tune the rules | 2 to 4 weeks |
| You do not have a working dispatch board | That is the bigger problem. Get automated dispatch running first, then layer skill matching on top | 8 to 12 weeks total |
The right starting point is the one your team will actually use. A perfect model that dispatchers override is worth less than a simple model that dispatchers trust.
How AnovaGrowth Builds Tech Matching Systems
Most of our field service clients come to us after they have already optimized the visible parts of the business: marketing, intake, scheduling, invoicing. The bottleneck has moved to dispatch and field execution, and within that, the highest-value move is tech assignment. We build the matching model, the data pipeline, and the dispatcher workflow. For 5 to 50 truck operations, the build runs 4 to 6 weeks and pays for itself in the first quarter.
We have built these systems for HVAC, plumbing, electrical, pest control, lawn care, pool service, and appliance repair companies. The pattern is the same across industries. The weights shift slightly. The guardrails change based on regulatory requirements. The scoring logic is portable.
If you are running a field service business and your first-time fix rate is below 80 percent, the fastest way to find out what is costing you is a 30-minute call. We will look at your dispatch board, your job history, and your tech roster, and tell you what your current FTFR probably is, what the largest single driver is, and what the first 90 days of work look like. No pitch. No pressure.
Ready to raise first-time fix rate and cut callbacks? Contact us to map your tech matching system.
Frequently Asked Questions
What is a good first-time fix rate for a field service business?
Healthy field service operations run 85 to 92 percent. Above 92 percent usually means either outstanding training and processes or a sign that callbacks are being miscoded. Below 80 percent is the danger zone where churn risk and operating cost both start climbing quickly. The benchmark varies slightly by industry. HVAC and plumbing tend to land 80 to 88 percent. Appliance repair tends to run 85 to 92 percent because the diagnostic scope is narrower.
How much does AI tech skill matching cost to build?
For a 5 to 50 truck operation, the build runs $8,000 to $25,000 depending on data quality, the existing FSM stack, and how much integration work is required. Most projects pay back the build cost in 60 to 120 days from the FTFR lift alone, before counting retention gains and review improvements. Custom enterprise builds for fleets over 100 trucks run higher but use the same model architecture.
Do I need a data team to run tech matching?
No. A service business with a working CRM or FSM and basic spreadsheet skills can build the first version in two to four weeks. The initial scoring is a weighted spreadsheet. The model is upgraded to a real-time recommendation engine once the spreadsheet version proves out. Most of our clients are running the spreadsheet version within a month of kickoff.
How long before first-time fix rate actually moves?
In our deployments, FTFR usually ticks up within the first 30 days once dispatchers start following the recommendations. The big jump happens between weeks 8 and 14, after override rates drop and the system has accumulated enough outcome data to refine the weights. Expect 4 to 8 points of lift in the first quarter, with continued improvement in quarters two and three.
What if my dispatchers do not trust the system?
That is the most common rollout risk. Dispatchers built their intuition over years, and they will not abandon it because a new model told them to. The fix is the shadow mode stage: run the model in parallel for 30 days, show dispatchers the comparison, and let the data change their minds. Dispatchers who see their own assignments next to the model's recommendations, and the outcomes side by side, almost always come around within a month.
Does tech matching work for one-tech operations or very small fleets?
It works but the value is smaller. With one or two techs, there is not enough choice for matching to matter. With three to five techs, a simple two-factor scorecard (skill match yes/no, certification match yes/no) is usually enough. The full weighted model becomes valuable around the 8 to 10 truck mark and gets sharper as the fleet grows.
Will AI tech matching replace my dispatcher?
No. The dispatcher still owns the schedule, the customer relationships, the exception handling, and the human judgment that no model can replicate. What changes is the default recommendation. The dispatcher stops being a search engine for "who is available" and starts being an editor who approves or adjusts the model's choice. Most dispatchers prefer this. The job gets less clerical and more strategic.
How does tech matching interact with route optimization?
Tech matching runs before route optimization. Once the right tech is assigned to the right job, the route optimizer sequences the day's stops for that tech efficiently. Matching without routing leaves time on the table. Routing without matching leaves first-time fix on the table. Both together compound. The automated dispatch guide covers the routing layer in detail.
What data do I need to start?
The minimum viable dataset is: tech ID, job ID, equipment family, problem category, parts used, completion status, callback flag, and date. Six months of this data is enough for the first model. Twelve months is better. We have built useful models from as little as 90 days of clean data, but the weights are noisier and the lift takes longer to show up.
How do I measure the lift without a clean baseline?
Pick a four-week window before the rollout, pull every job from that window, and calculate FTFR by tech and by job category. That is your baseline. Re-run the same calculation at 30, 60, and 90 days post-rollout. The number will not be perfectly clean because of seasonality, but it will be close enough to see whether the system is moving the needle. Pair it with callback rate as the honesty check.