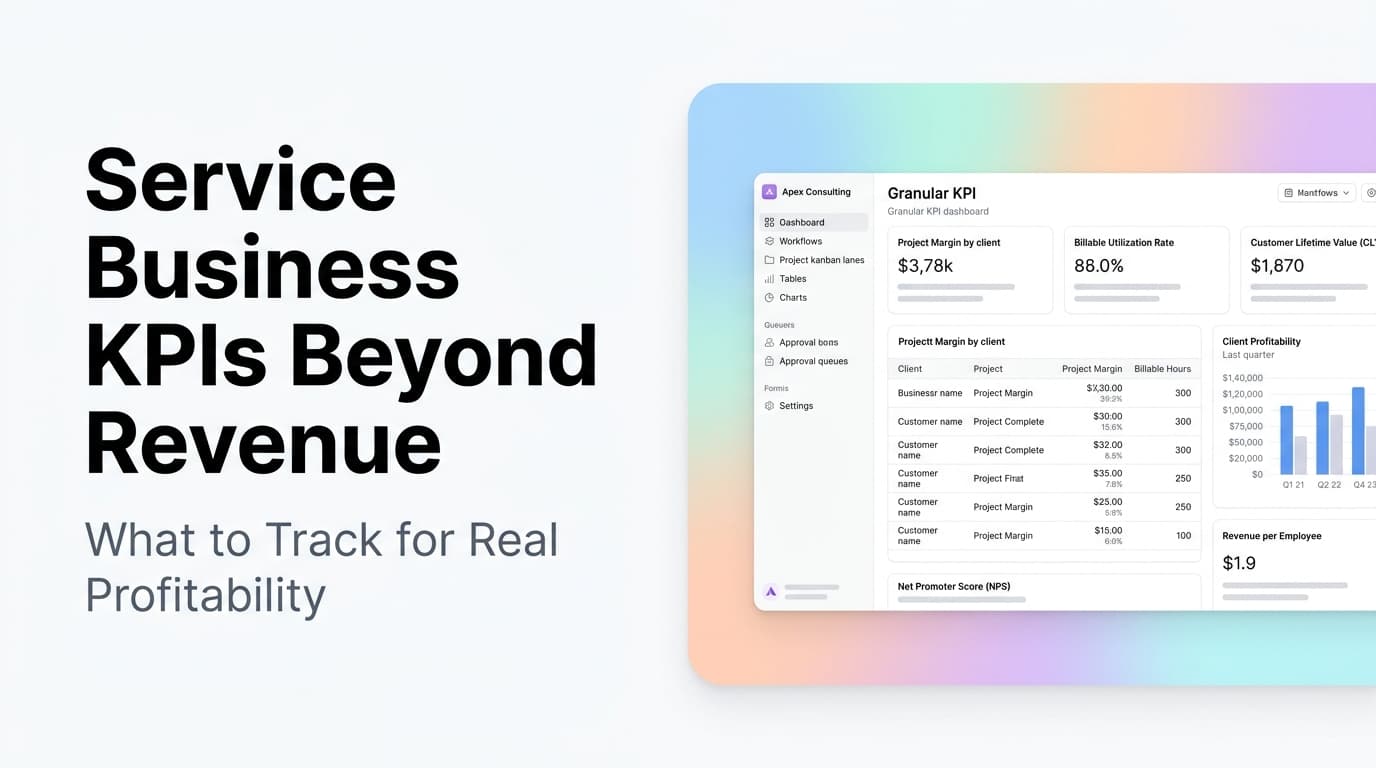
Service Business KPIs Beyond Revenue: What to Track for Real Profitability
Revenue tells you if you are busy. These 7 KPIs tell you if you are actually profitable. Stop guessing which jobs, customers, and services make you money.

Quick Answer: What Should Service Businesses Track Besides Revenue?
Most service business owners can tell you their monthly revenue but not their profit per job, cost per lead, or customer lifetime value. The seven KPIs that matter most are: job profitability margin, effective hourly rate, customer acquisition cost, customer lifetime value, lead-to-close rate, technician utilization, and recurring revenue percentage. Track these and you stop making decisions on gut feel.
The Revenue Trap
Every service business owner I have talked to knows their monthly revenue number. They check it like a pulse. Revenue went up, good month. Revenue went down, bad month.
Here is the problem: revenue is a vanity metric. It tells you how much money moved through your business, not how much you kept. A $50,000 month with 5% margin is worse than a $30,000 month with 25% margin. But most owners celebrate the $50k and stress about the $30k.
At AnovaGrowth, we build analytics dashboards for service businesses. The first thing we do is pull the real numbers. Almost every time, the owner is surprised by what they find. A service they thought was their best performer is actually losing money. A customer they love is their least profitable. A technician they consider average is their highest-margin worker.
This is not about having more data. It is about tracking the right data.
The 7 KPIs That Actually Matter
1. Job Profitability Margin
This is the single most important number in your business. It is the profit left after you subtract all direct costs for a specific job: labor, materials, travel, subcontractors, disposal fees, permits.
What most businesses track: Total job revenue. What you should track: (Job Revenue - Direct Costs) / Job Revenue.
A job that brings in $2,000 but costs $1,800 in labor and materials has a 10% margin. A $1,200 job with $600 in costs has a 50% margin. The smaller job is more profitable.
How to get this data: Your CRM or job management software should track costs per job. If it does not, start recording material costs and labor hours against each work order. Most modern service CRMs (Housecall Pro, ServiceTitan, Jobber) support this natively. The trick is actually using the fields.
2. Effective Hourly Rate
Billable rate is what you charge. Effective hourly rate is what you actually earn after accounting for drive time, prep time, cleanup, and unpaid time between jobs.
Formula: Total Revenue from Jobs / Total Hours Worked (including drive and admin).
If you charge $150/hour but your techs spend 30% of their day driving and 10% on paperwork, your effective rate is closer to $90/hour. That changes how you price jobs and how you schedule.
What to do about it: Route optimization software can cut drive time by 15-25%. Automated job documentation cuts paperwork time. Both directly improve your effective rate without raising prices.
3. Customer Acquisition Cost (CAC)
How much does it cost you to get one new paying customer? Include ad spend, website costs, sales commissions, software subscriptions, and the time you spend on estimates and follow-ups.
Formula: Total Sales and Marketing Costs / Number of New Customers.
If you spend $3,000 on Google Ads, $500 on your website, and 20 hours of your time at $100/hour on estimates, and you close 5 new customers, your CAC is ($3,000 + $500 + $2,000) / 5 = $1,100 per customer.
Why this matters: If your average customer generates $800 in profit over their lifetime, you are losing money on every new customer. You need to either lower your CAC or increase your customer lifetime value.
4. Customer Lifetime Value (LTV)
How much total profit does a typical customer generate over the entire time they do business with you? This is not just their first job. It includes every service call, maintenance visit, upsell, and referral they send your way.
Formula: Average Profit per Job x Average Jobs per Year x Average Customer Lifespan in Years.
A customer who spends $500 per year on maintenance and stays for 5 years is worth $2,500. A customer who spends $2,000 on one emergency repair and never calls again is worth whatever margin you made on that single job.
The insight: Service businesses that track LTV realize their most valuable customers are often not their biggest spenders. They are the ones who book regular maintenance, pay on time, and refer neighbors.
5. Lead-to-Close Rate
What percentage of leads become paying customers? This is the most overlooked metric in service businesses.
Formula: Number of Closed Jobs / Number of Qualified Leads.
A 30% close rate means you lose 7 out of 10 leads. If you improve that to 40%, you grow revenue by 33% without spending a dollar more on marketing.
Where leads leak: Slow response time is the biggest killer. Service businesses that respond to web leads within 5 minutes close at 9x the rate of those that wait 30 minutes. Automated lead qualification and instant scheduling can push your close rate from 25% to 40% or higher.
6. Technician Utilization Rate
What percentage of your technicians' paid time is spent on billable work? The rest is drive time, waiting for parts, paperwork, meetings, and idle time.
Formula: Billable Hours / Total Paid Hours.
If a tech is paid for 40 hours but only bills 25, their utilization rate is 62.5%. Industry benchmarks for service businesses are 65-75%. Top performers hit 80% or higher.
How to improve it: Better dispatch routing, automated job status updates that reduce phone calls, and pre-stocked inventory on trucks. Every percentage point of utilization improvement adds directly to your bottom line.
7. Recurring Revenue Percentage
What portion of your revenue comes from repeat customers, maintenance contracts, or subscription services?
Formula: Recurring Revenue / Total Revenue.
Service businesses with 30% or more recurring revenue grow 3x faster than those relying entirely on one-time jobs. Recurring revenue is predictable. It smooths out seasonal swings. It makes your business worth more if you ever want to sell.
Decision Table: Which KPI to Fix First
| If This Is Your Problem | Track This KPI | Target |
|---|---|---|
| You are busy but not making money | Job Profitability Margin | 30%+ per job |
| Your team is always working but revenue is flat | Effective Hourly Rate | $100+/hour |
| You spend a lot on marketing but growth is slow | Customer Acquisition Cost | Under 25% of LTV |
| Customers leave after one job | Customer Lifetime Value | 3x+ CAC |
| You get lots of calls but few bookings | Lead-to-Close Rate | 40%+ |
| Your techs are always behind | Technician Utilization | 75%+ |
| Revenue swings wildly month to month | Recurring Revenue % | 30%+ |
How to Actually Track These (Without a Data Team)
The biggest objection I hear is "I do not have time to track all this." Fair. You are running a business. You are not a data analyst.
Here is what actually works: set up your CRM to calculate these automatically. Most service CRMs can track job costs, lead sources, and customer history. The missing piece is usually a dashboard that pulls it all together.
At AnovaGrowth, we build custom analytics dashboards that connect to your existing tools. We pull data from your CRM, your scheduling software, your accounting platform, and your phone system into one view. You open one page and see all seven KPIs updated in real time.
No spreadsheets. No manual data entry. No guessing.
Proof: What Happens When You Track the Right Numbers
We worked with a plumbing company in the Southeast that was doing $1.2M in annual revenue. The owner thought they were doing well. Revenue was up 15% year over year.
We built a dashboard that tracked job profitability by service type. The data showed their drain cleaning service, which they promoted heavily, had a 12% margin. Their water heater replacement service had a 38% margin. They were spending marketing dollars on their least profitable service.
They shifted their ad budget toward water heater replacements and added a maintenance plan program. Within 6 months, their overall margin went from 18% to 27%. Revenue stayed flat, but profit increased by $108,000 per year.
The owner said: "I thought I knew my business. I did not."
Related Questions Business Owners Ask
- How do I calculate job profitability when costs vary by location?
- What is a good customer acquisition cost for a local service business?
- How do I track technician utilization without manual time sheets?
- What CRM features do I need for KPI tracking?
- How often should I review these metrics with my team?
- Can I connect my existing software to a custom dashboard?
Getting Started
Pick one KPI from the table above that matches your biggest problem right now. Track it for 30 days. Just one number. See what it tells you.
If you want a dashboard that tracks all seven automatically, talk to us. We build these for service businesses. You bring the tools you already use. We connect them and show you what matters.
Ready to see your real numbers? Contact AnovaGrowth to discuss a custom analytics dashboard for your service business.
Related articles

Service Business Weekly Operations Meeting: The 30-Minute Cadence That Keeps a Small Service Company on Track
A 30-minute weekly ops meeting turns scattered owner reactions into one predictable cadence. Most service companies under 50 people can run it themselves.
Read the article: Service Business Weekly Operations Meeting: The 30-Minute Cadence That Keeps a Small Service Company on Track
Service Business Year-End Planning Playbook: Q4 Tax Prep, Operations Tune-Up, and the Setup That Wins Q1
Most service businesses lose Q4 to last-minute scramble and limp into Q1 with bad books. A 90-day Q4 plan fixes tax, cash, hiring, and ops in one sweep.
Read the article: Service Business Year-End Planning Playbook: Q4 Tax Prep, Operations Tune-Up, and the Setup That Wins Q1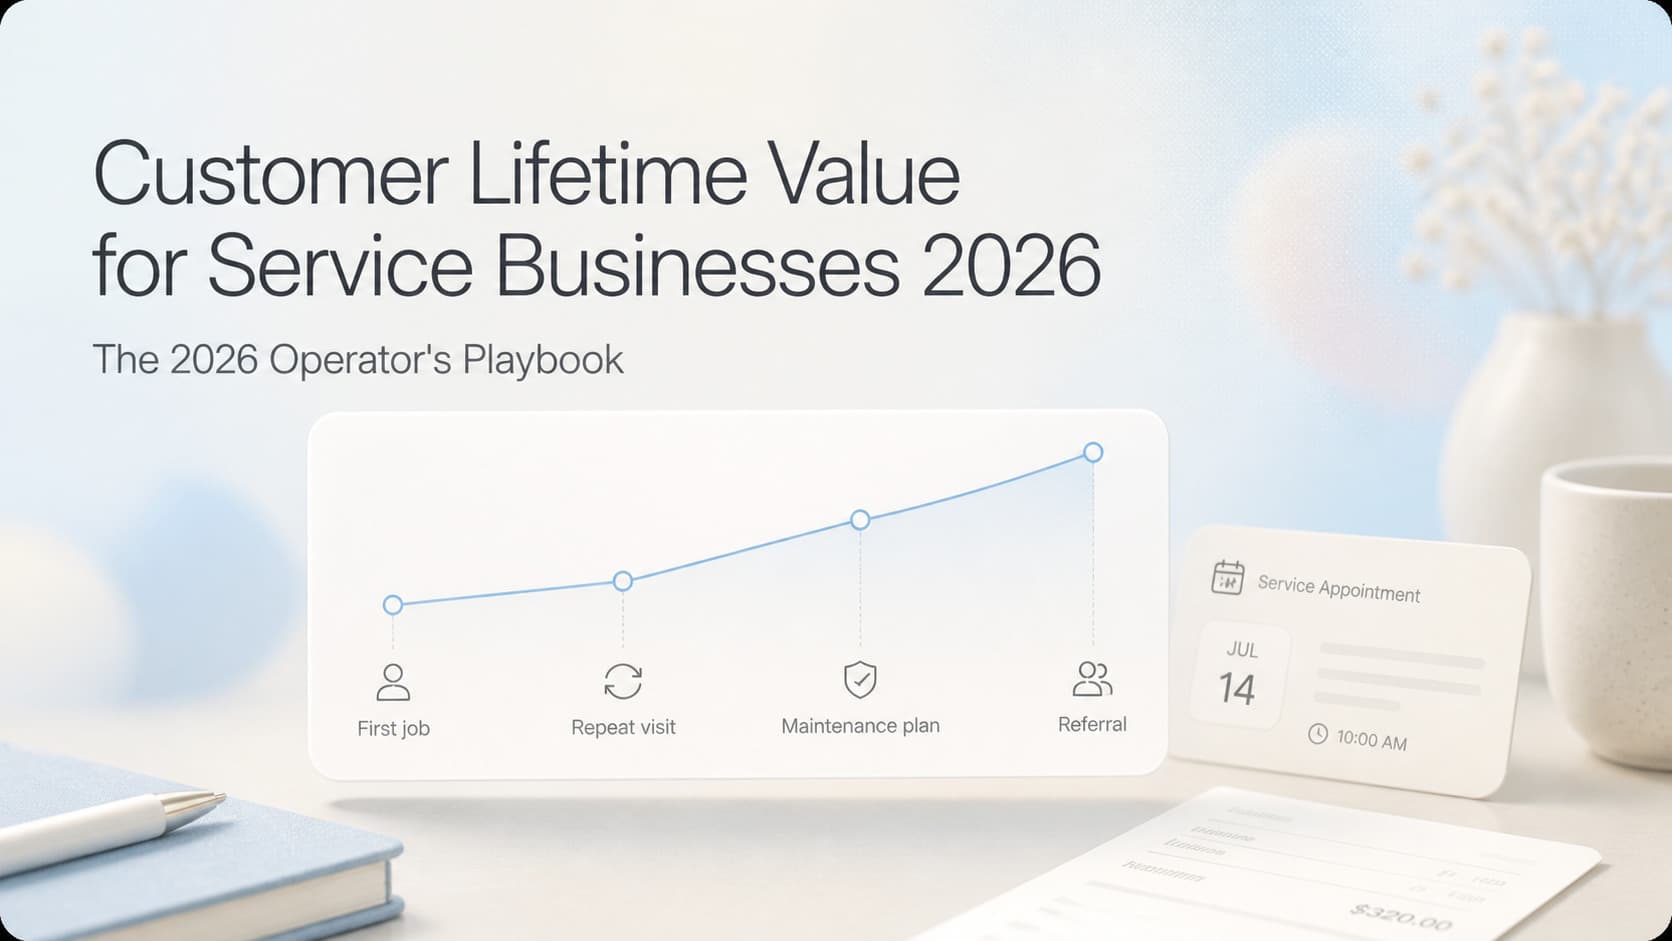
Customer Lifetime Value for Service Businesses: The 2026 Operator's Playbook
Customer lifetime value is the number every service business should run on. Here is the formula, the segmentation, and the automation that actually grows it.
Read the article: Customer Lifetime Value for Service Businesses: The 2026 Operator's Playbook
