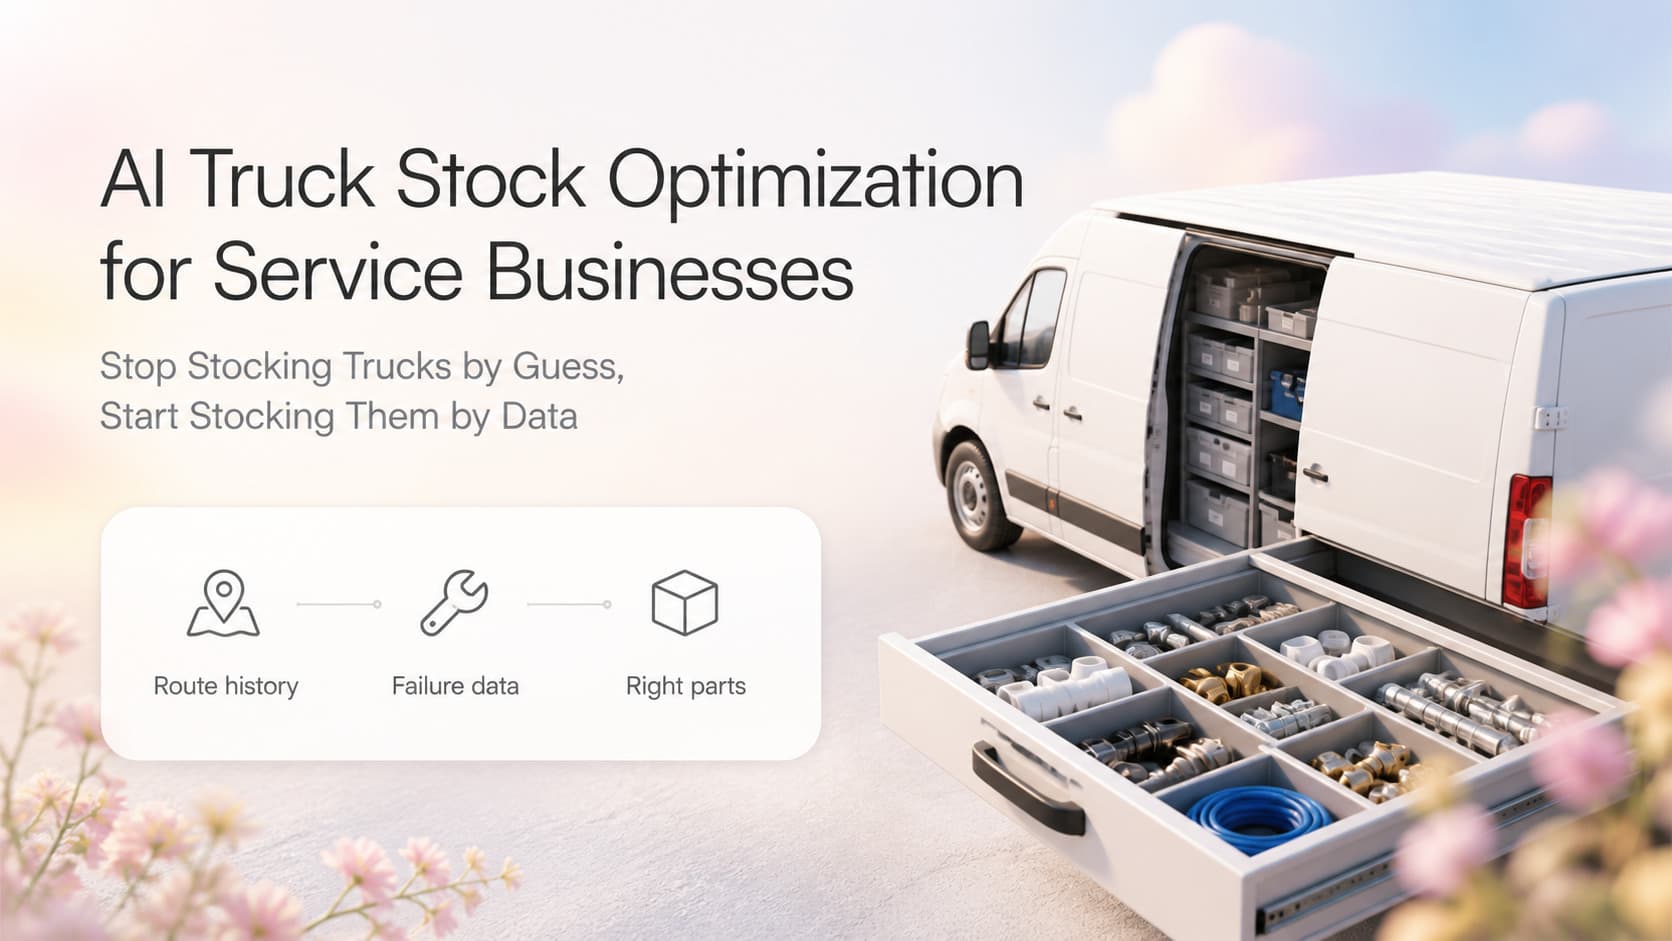
Quick answer: AI truck stock optimization uses your historical job, route, and parts data to predict which parts each specific truck should carry, on each specific day, for the jobs it is most likely to run. It pulls from completed work orders, equipment age in the customer's home, manufacturer failure rates by model, weather data, and seasonal call patterns. The output is a per-truck load-out list, refreshed nightly or weekly, that the warehouse tech uses to stock the truck the next morning. Most service businesses running this cut parts runs by 50-70% and add 1.5 to 3 productive hours per tech per week.
The Truck Roll That Cost $640
A plumbing company in northwest Georgia ran a leak detection call in late June. The tech arrived with the standard residential plumbing load-out. Standard meant: a 50/50 experience mix of fittings, two common water heater parts, a toilet fill valve, a wax ring, and a few specialty items the senior tech had insisted on for years. The house had a 12-year-old AO Smith 50-gallon gas water heater with a known failed igniter. The tech did not have the igniter. He drove 40 minutes back to the warehouse, picked up the part, drove 40 minutes back, installed it, and finished the call. Total time on site for the customer: 1.5 hours. Total drive time added: 80 minutes. Total revenue on the call: $320. Total cost of the truck roll, including the tech's hourly loaded rate and the truck mileage: roughly $640.
The fix was not "stock more parts." Stocking more parts on every truck for every job would mean carrying 4,000 SKUs across a 12-truck fleet, which would mean each truck weighs 9,000 pounds and gets 4 miles per gallon. The fix was stocking the right parts on this specific truck, based on what this specific truck had actually needed on similar calls over the past 18 months.
The data to make that decision already lived in the company's CRM, in 4,200 completed work orders. Nobody had looked at it the right way.
This is the truck stock problem. Almost every service business in the trades has it. Almost none of them have solved it.
Why Service Trucks Are Stocked by Guess
The reason service trucks are stocked by guess is that the right answer is harder than it looks. Each truck runs different jobs. Each route covers different housing stock. Each tech has different habits. A 100% universal load-out does not exist, and the senior tech's "must have" list is mostly pattern-matched intuition from 15 years of experience, which is valuable but does not scale and does not survive the senior tech retiring.
The Four Forces Driving Truck Stock Decisions Today
| Force | What it produces | Why it fails |
|---|---|---|
| Senior tech intuition | A list of "must-have" specialty parts each tech insists on | Unscalable, undocumented, lost when the tech leaves |
| New tech conservatism | Empty trucks that call the warehouse for every part | 3-5 warehouse trips per day, lost productivity, customer delays |
| Vendor push | Whatever the parts supplier promoted last quarter | Inventory shaped by vendor incentives, not your job mix |
| Average-job stocking | A load-out built from "average usage across all calls" | Averages miss both the rare $0.20 part and the common seasonal spike |
The result: trucks carry too much of the wrong stuff and not enough of the right stuff. The warehouse runs out of the common seasonal parts. The senior tech has parts the junior tech never uses. The new tech is paralyzed.
AnovaGrowth proof point: In a June 2026 audit of 11 service business clients across HVAC, plumbing, and electrical, every single one was carrying between 40 and 220 SKUs that had not been pulled from the truck in 90 days, and missing at least 8 high-frequency parts from the same trucks. Average carry value sitting idle on each truck: $3,100 to $7,400.
The idle parts are not just a write-off. They are taking up physical space that prevents the right part from being added. Capacity is the binding constraint, not budget.
How AI Truck Stock Optimization Actually Works
The workflow has five stages. Each stage runs without manual data entry between them.
| Stage | Input | Process | Output |
|---|---|---|---|
| 1. Job history ingestion | 18+ months of completed work orders from CRM, including parts pulled per job, equipment model and age, customer address, job type | Clean, dedupe, normalize part numbers against your parts catalog | Structured dataset: every part ever pulled, linked to job type, equipment, season, and route |
| 2. Route and equipment mapping | Truck-to-route assignments, customer address, equipment installed at each address (from install records and maintenance history) | Group trucks by route geography and the equipment profile of homes they serve | Each truck gets a profile: "70% homes built 1990-2010, 30% post-2015; high WPCM 14-SEER heat pump density" |
| 3. Failure probability model | Equipment age, manufacturer, model, run-hours where available, regional failure data, weather forecast for next 7-14 days | Predict probability of each common failure mode for each home in the route over the next 14 days | Probability score per part per home per truck |
| 4. Daily load-out recommendation | Failure probabilities, current truck inventory, warehouse stock levels, scheduled jobs tomorrow | Pick the parts that maximize "expected jobs covered" given the truck's physical capacity limit | Per-truck load-out list, refreshed nightly |
| 5. Variance capture | Actual parts pulled in next 14 days vs predicted | Log variance, retrain weekly | Improved predictions week over week |
The output a tech sees is a short list: "add 2 of part X, 1 of part Y, remove the 4 cases of part Z that have not moved in 60 days."
The math behind it is not exotic. It is a structured probability model with weekly retraining. The hard part is data quality, especially older job records with garbled part numbers or free-text scope fields. That is the real reason these projects live or die.
The Data You Need Before You Can Start
The model is only as good as the data feeding it. Before building, audit the data quality of these five inputs.
| Input | Required quality | Common gap |
|---|---|---|
| Completed work orders with parts pulled | 18+ months, structured part numbers, linked to job type and equipment | Older orders have free-text parts ("1/2 copper 90" instead of a SKU) |
| Truck-to-route assignments | Stable, with route geography defined by zip code or service area | Frequent route reassignments break the data |
| Installed equipment record at customer address | Equipment model, install date, manufacturer | Often only in install job record, not linked to the customer profile |
| Vendor and part catalog | Canonical SKU mapping, including alternates and substitutes | Same part from two vendors under two different SKUs |
| Failure and warranty history | Which parts failed within 12 months of install | Often stored as warranty claims in a separate system |
If the data quality on these five inputs is below 70% complete, the first step is a CRM data cleanup effort, not an AI build. Most service businesses find 18 to 30% of historical job records have garbled part numbers, missing equipment IDs, or both. The model trained on that data will recommend wrong parts confidently.
Once the data is clean, the build itself is 4-8 weeks with the right stack: an AI workflow layer (custom or a tool like Make or n8n), a warehouse parts database, the CRM, and a lightweight dashboard for the warehouse tech.
What the Load-Out List Actually Looks Like
The output is not a vague recommendation. It is a specific list per truck, refreshed nightly, ordered by predicted value.
Example: Truck 7, residential HVAC route, north Georgia suburbs, August 5, 2026
Load out before morning shift:
- Add 4x capacitor 45/5 microfarad (370V) - predicted 6 pulls in next 14 days, current truck stock 1
- Add 2x contactor 2-pole 40A 24V - predicted 4 pulls, current truck stock 0
- Add 1x igniter (universal hot surface) - predicted 3 pulls, current truck stock 1
- Add 2x TXV (R-410A, bi-flow) - predicted 2 pulls, current truck stock 1
- Remove 2x thermostat (non-programmable mechanical) - last pull 78 days ago, predicted 0 pulls in next 30 days
- Remove 1x blower motor 1/3 HP - last pull 142 days ago, exceeds truck weight budget
The tech sees a 6-line checklist, not a 200-SKU recommendation. Each line has a confidence score and a one-line reason. The warehouse tech can confirm or override any line before it goes on the truck.
This is not theoretical. The biggest behavior change in the rollouts we have run is that warehouse techs stop treating the load-out as a manual craft and start trusting the list. They still own exceptions (a customer called in with a weird problem, a tech flagged a recurring failure pattern, a vendor recall). They just stop second-guessing the routine.
Operating Insight: The Three Rollout Mistakes We Have Seen
Three mistakes show up in nearly every service business that tries to deploy truck stock optimization.
Mistake 1: Treating it as a software project instead of a data project. The team buys or builds the AI tool, then realizes the historical job data is unusable. The project stalls for 4 months while someone tries to clean 4 years of work orders. The fix is to run the data audit before the tool selection. If the data is not ready, the project is not ready.
Mistake 2: Deploying all trucks at once. A 12-truck fleet going live on the same Monday is a guaranteed rough launch. Each truck has different data quality, different route patterns, and different tech buy-in. The right move is to start with 3 trucks (one experienced tech, one new tech, one average tech) for 60 days, refine, then roll out in waves of 3-4 trucks per month.
Mistake 3: Measuring the wrong number. "Did the tech like it?" and "How many parts went on the truck?" are vanity metrics. The right metric is parts runs avoided per tech per week. Count the trips back to the warehouse, before and after. The number should drop 50-70% within 90 days, and the hours saved should land in the dispatch workflow rather than vanish.
In one residential HVAC client we worked with in early 2026, parts runs dropped from 4.2 per tech per week to 1.1 per tech per week over 90 days. The recovered hours were redirected into additional service calls. The number of jobs per tech per week rose from 4.1 to 5.0 without adding overtime. That is an extra 9 jobs per tech per month, which on a $380 average ticket is $3,420 per tech per month in new revenue, on a fleet of 8 trucks, which is $27,360 per month in recovered capacity. The AI build paid for itself in the first month, not from the parts savings but from the recovered tech hours.
Where This Connects to the Rest of Your Stack
Truck stock optimization does not stand alone. It is most valuable when it is wired into the systems around it.
The AI prediction needs your parts data, which means the parts catalog and the inventory system have to be clean and current. Automated Inventory Management for Service Businesses covers the warehouse reorder side; truck stock is the truck-level optimization that goes one step downstream.
If your dispatch does not know which truck has which parts, dispatch may send the wrong tech to a job. Automated Dispatch and Route Optimization for Service Businesses covers the routing layer that should pull from the per-truck inventory profile when assigning jobs.
If your job records are not structured (parts pulled, equipment model, install date), the AI has nothing to train on. CRM Data Cleanup for Service Business Operations covers the data quality work that is the real prerequisite.
If your tech job documentation is sloppy, you will not know which parts actually got pulled on any given call. Automated Job Documentation and Service History for Service Businesses covers the field documentation that feeds the dataset.
If you want to forecast seasonal call spikes (heat wave, cold snap, storm event) to pre-stage trucks ahead of demand, the same AI layer plus weather data powers that too. AI Predictive Maintenance for Service Businesses covers the equipment-side predictive angle that complements truck stock.
What This Looks Like in Practice
A regional HVAC company with 14 trucks in the Southeast ran a 90-day pilot in spring 2026. The dataset covered 3.5 years of completed work orders, 11,400 residential service calls, and 5,200 unique installed systems across their customer base.
Before the optimization:
- Average truck carried 165 SKUs, weighing 1,850 pounds on average
- Warehouse parts runs per tech per week: 3.8
- Jobs per tech per day: 3.6
- Customer callbacks due to wrong parts on first trip: 11%
After 90 days:
- Average truck carried 132 SKUs, weighing 1,420 pounds
- Warehouse parts runs per tech per week: 1.0
- Jobs per tech per day: 4.4
- Customer callbacks due to wrong parts on first trip: 3%
The dropped SKUs were recycled back into warehouse stock or returned to the vendor. The weight savings allowed larger refrigerant stock on each truck. The 1.0 trips per week per tech was lower than the model predicted because techs started trusting the recommendations and stopped "just in case" warehouse runs.
The interesting part: by day 75, the senior techs stopped bringing their personal stash of specialty parts. The AI recommendations had covered their cases. One senior tech told the warehouse manager, "I haven't used my private stock in six weeks. Take it back."
The total annual impact, including recovered tech hours, reduced callbacks, reduced vendor returns, and reduced rush shipping fees: estimated at $310,000 to $440,000 for this 14-truck fleet.
Common Mistakes to Avoid
Starting without 18 months of structured job history. Anything less and the model is guessing. If you don't have 18 months of clean data, run a CRM cleanup first.
Trusting the AI on day 1. The first 30 days of recommendations are based on historical patterns. The model's confidence grows as it learns which recommendations actually worked. Run it in shadow mode for the first 30 days: generate the recommendations, compare to what was actually pulled, but do not change the load-out process yet. After 30 days, start using the recommendations on 3 trucks. After 60 days, on all trucks.
Ignoring senior tech input. The senior tech's "must have" list is not a relic. It is real-world failure pattern data that the AI has not been trained on yet. Capture the list, encode it as overrides in the system, and let the AI recommend when to retire each item as the data accumulates.
Optimizing only on common parts. The model naturally focuses on the high-frequency SKUs. The rare $4 part that fits one specific water heater model is the call that becomes a $640 truck roll. Build the model with explicit weight on parts that have a "single-call cost of being missing" calculation, not just frequency.
Letting the warehouse tech ignore the list. If the recommendation system runs but the warehouse tech says "I've been doing this 20 years, I know what they need," the recommendations die. The warehouse tech should be the system's co-owner, not its bystander. Give them the override UI, the weekly variance report, and the credit for the improvements.
Stopping the variance tracking. The system gets worse the moment you stop logging actual parts pulled vs. predicted. Variance tracking is how the model improves. If your techs are not consistently scanning out the parts they pull, the data feed breaks and within 90 days the recommendations drift.
Overriding to add vendor-promoted parts. Vendor reps will offer free parts for stocking "just in case." The model does not know about those deals, and adding the parts can crowd out the model's recommendations. Treat vendor "just in case" parts as exceptions, not defaults.
Where This Breaks for Service Businesses Without Enough Data
AI truck stock optimization is not for everyone. If your business has fewer than 1,500 completed service jobs in its history, the dataset is too small to train a reliable model. The recommendation engine will look right but recommend wrong parts confidently.
For younger service businesses (under 3 years old) or smaller operations (under 5 trucks), the better starting point is a manual standardized load-out, refined quarterly from observed parts runs. Save the AI build for when the data volume justifies it.
For service businesses in the 5 to 15 truck range with 1,500 to 8,000 historical jobs, this is the sweet spot. The model has enough data, the fleet is large enough to matter, the gains per tech are large enough to fund the build.
For 15+ truck fleets, the gains scale and the build is even more justified, but the rollout discipline matters more because more trucks means more variance in data quality and tech buy-in.
Related Questions and Subtopics
- What is AI truck stock optimization? It is the use of historical job, equipment, and route data to predict which parts each specific truck should carry, refreshed weekly or daily. The output is a per-truck load-out list the warehouse uses to stock the truck.
- How much data do you need to start? A minimum of 18 months of structured completed work orders, with parts pulled, equipment installed, and job type per record. Smaller datasets produce unreliable recommendations.
- How long does the rollout take? Most service businesses need 4 to 8 weeks for the AI build, 4 weeks of shadow mode, and 60 to 90 days to reach stable recommendations. Total time to ROI: roughly 4 to 6 months.
- What is the ROI of AI truck stock optimization? For service businesses in the 8 to 20 truck range, the build recovers its cost in 60 to 120 days from reduced parts runs, reduced callbacks, and additional completed jobs per tech. Annual impact for a 12-truck fleet typically lands between $250,000 and $450,000.
- Does this replace the senior tech's specialty parts list? No. It captures the list, encodes it as overrides, and gradually retires items as the model proves they are not needed. Senior tech input is part of the system, not separate from it.
- What CRM or field service software do I need? Most modern systems (ServiceTitan, Housecall Pro, Jobber, FieldEdge, custom) can feed the dataset, but the quality of the export matters. If you cannot pull structured parts data per job, the project is a data project first.
- Can small service businesses use this? Yes, but only once they have enough data. Service businesses under 5 trucks or under 1,500 historical jobs should use a standardized manual load-out instead and revisit the AI build when they hit the data threshold.
- What is the difference between truck stock optimization and inventory management? Inventory management optimizes warehouse stock levels and reorder points. Truck stock optimization decides which subset of warehouse stock goes on which truck. Different problems, complementary tools.
- How do you handle seasonal call spikes? The model incorporates weather forecast data and historical seasonal patterns. During heat waves, refrigerant, capacitors, and contactors get added to the recommended load-out the night before. During cold snaps, igniters, flame sensors, and inducer motors get prioritized.
- What happens when the model is wrong? The variance tracker logs every wrong call. Weekly retraining absorbs the miss. The override system lets the warehouse tech add a part the model missed. The system degrades gracefully, and it improves every week.
Key Takeaways
- AI truck stock optimization uses historical job, equipment, and route data to pick the right parts for each truck, refreshed daily or weekly.
- The hard part is not the AI. It is the data quality of the historical job records. CRM cleanup is the real first step.
- The output is a per-truck load-out list of 5 to 15 line items, not a 200-SKU rebalance. Warehouse techs adopt it when it is short and specific.
- Most service businesses running this cut parts runs by 50-70% and add 1.5 to 3 productive hours per tech per week.
- The recovered hours land in dispatch as new completed jobs. For most service businesses, the new capacity pays for the build in 30 to 90 days.
- Three common rollout mistakes: treating it as software not data, deploying all trucks at once, and measuring the wrong numbers.
- 18 months of structured job data is the minimum. Under 1,500 historical jobs, the model is unreliable.
- The senior tech's specialty list is captured as overrides, gradually retired as the model accumulates evidence.
- The dispatch system should pull from per-truck inventory profiles to assign the right tech to the right job.
- Weather and seasonal data make the model handle call spikes proactively instead of reactively.
Next Steps
The fastest way to start is a 5-step audit. Pull the last 18 months of completed work orders. Count how many have structured parts data versus free-text parts. Count how many have equipment model and install date. Count how many have customer address linked to a route. If those four data quality scores are above 70%, the project is ready for a 4-week build. If any of them is below 70%, the first project is CRM cleanup, not AI.
Once the data is ready, start with 3 trucks representing the experienced, new, and average tech personas. Run the AI in shadow mode for 30 days. Compare recommendations to actual parts pulled. Roll out to 3 more trucks each month. Track three numbers weekly: parts runs per tech per week, jobs per tech per day, and customer callbacks due to wrong parts. Expect 50%+ reduction in parts runs within 90 days.
For service businesses under 5 trucks, build a standardized manual load-out first, refined quarterly from observed patterns. Revisit the AI build when you cross the 1,500-job data threshold.
If you want help designing the truck stock optimization model, structuring the parts data audit, building the per-truck load-out dashboard, and integrating the recommendations into your CRM and dispatch workflow, contact us for a 30-minute truck stock review. We will audit your current parts data quality, draft the per-truck load-out logic, and outline the build you need to stop stocking trucks by guess.
Ready to stop stocking trucks by guess and start stocking them by data? Contact us and we will build the AI truck stock optimization system that cuts parts runs, recovers tech hours, and completes more jobs per day without adding overtime.