The Tech Who Quit on a Friday and the Numbers You Could Have Seen on Monday
Every service business owner has lost a tech they did not see coming. The call comes out of nowhere: "Hey, putting in my two weeks, last day is next Friday." You scramble. You offer more money. You think about how every job in next week's schedule just got harder.
The warning signs were there. Tenure hitting the industry-average cliff. A drop in customer satisfaction scores over the last quarter. PTO patterns that do not match past years. A dip in overtime willingness. Fewer callbacks to repeat customers. None of these signals looked like a resignation on its own. Together, they told a story that a human reading a stack of paper would never connect.
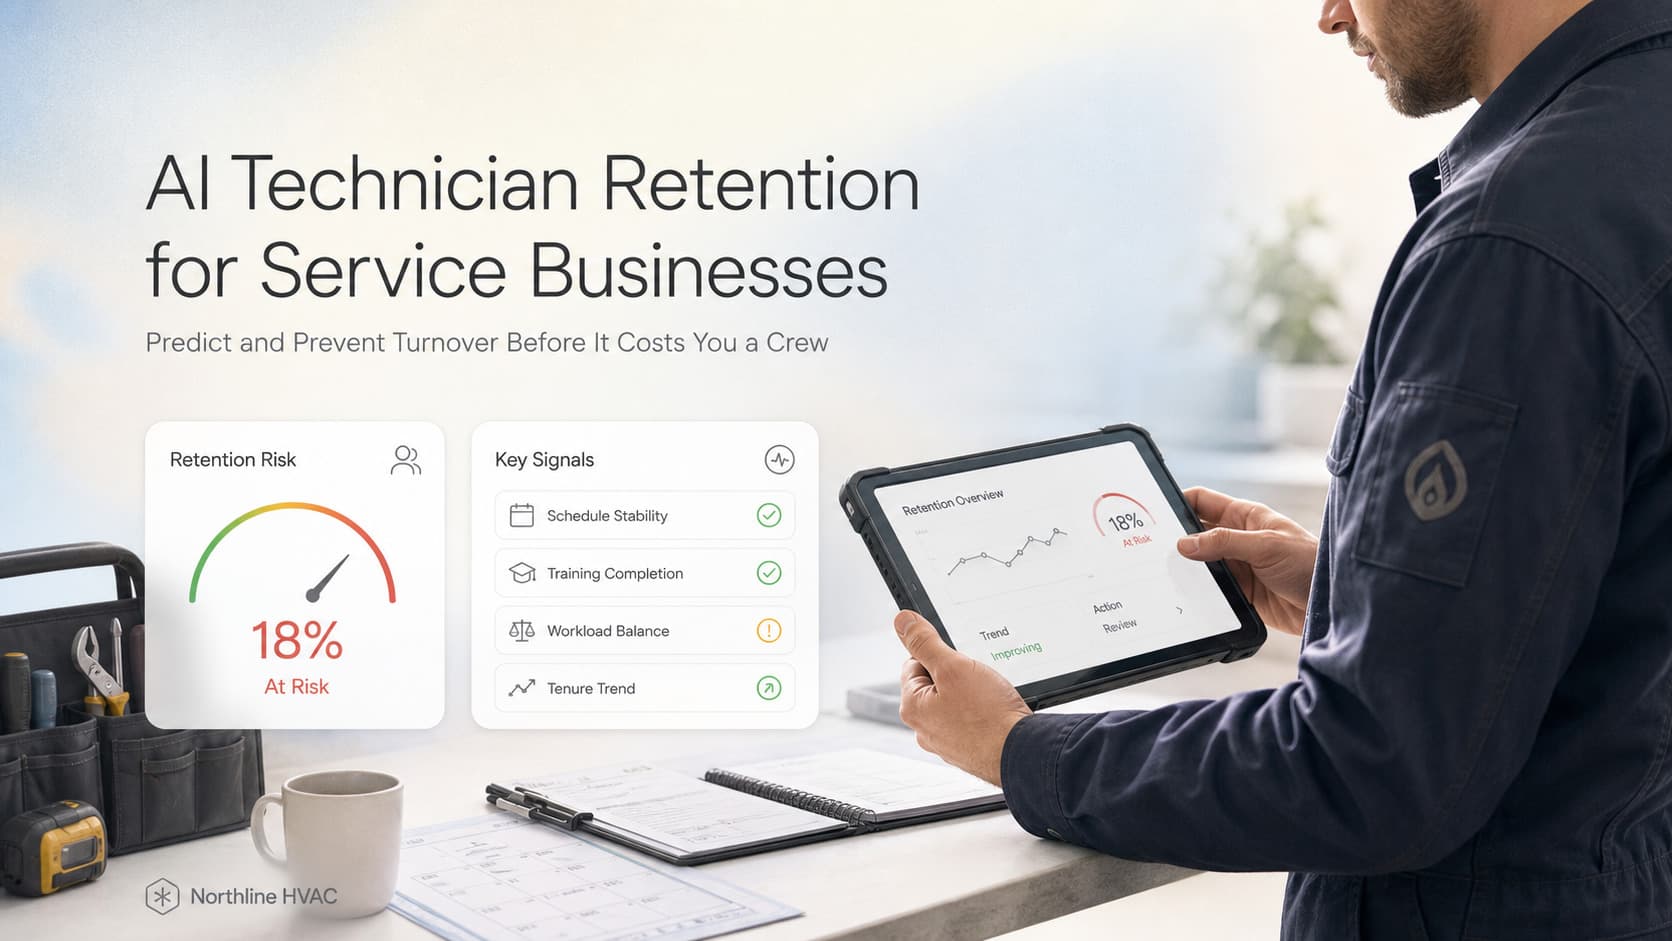
AI retention scoring reads that stack of paper. It watches the same signals you already have in your CRM, scheduling, and payroll systems, and it tells you which tech is most likely to walk in the next 90 days, what is driving the risk, and what to do about it.
Quick answer: AI technician retention combines tenure, performance review trends, scheduling patterns, customer feedback, overtime load, PTO behavior, and tenure-milestone risk into a per-tech flight-risk score. Service businesses using it catch 60-70% of voluntary quits 60-90 days in advance and recover most of them with targeted intervention. The model is only as good as the data feeding it, so cleanup of your CRM and HR records is step one. Run the score monthly, route high-risk techs to a manager-led playbook, and treat retention like the operational problem it is, not a vibes problem.
Why Service Business Turnover Is So Expensive
The skilled trades consistently rank at or near the top of every quit-rate survey. Most service business owners already know this in their gut. Few have priced what it actually costs them.
Three numbers most operators underestimate:
- Direct replacement cost. Recruiting, background checks, drug screening, uniforms, tools, truck setup, and onboarding training usually run into five figures per tech, and that is before productivity losses.
- Lost-billable-hours gap. A new tech is rarely fully productive for 6 to 12 months. Every month of ramp-up is revenue the business did not earn while paying a fully loaded tech to learn the route.
- Customer continuity damage. Customers like seeing the same tech. When a familiar face disappears, callback rates drop and complaints rise, especially on commercial accounts where the tech knows the site.
When you stack direct cost, lost productivity, and customer churn risk together, losing one experienced field tech typically costs a service business a multiple of that tech's annual wage. That is the number a retention system has to beat.
What AI Retention Scoring Actually Reads
You already have most of the data you need. The work is connecting it and asking the right questions.
| Data Source | What the Model Reads | Why It Predicts Turnover |
|---|---|---|
| Tenure and role history | Months in role, prior employers, promotion timeline | The 6-month and 18-month cliffs catch most first-job quits |
| Performance review scores | Trajectory over the last 4-8 reviews | A flat or declining review pattern correlates with disengagement |
| Customer satisfaction scores | NPS, callback rate, complaint frequency per tech | Customers vote with complaints before techs vote with resignations |
| Overtime and schedule patterns | Hours worked, weekend frequency, after-hours calls | Sustained overtime without recognition drives exits, especially in younger techs |
| PTO and time-off requests | Pattern shifts, unused PTO buildup, last-minute requests | Sudden PTO cash-outs often precede a final two-week notice |
| Compensation history | Wage growth vs market, last raise, bonus eligibility | Long gaps between raises are a leading indicator across industries |
| Communication and sentiment | Internal messages, dispatch interactions, complaint logs | Negative tone shifts in messages are surprisingly predictive |
The model combines these into a single per-tech score, ranks the roster, and surfaces the top drivers for each high-risk tech. The output is not "Tech A might quit." The output is "Tech A's risk is driven primarily by 14 months of stagnant wage growth plus a 22% drop in callback rate, recommended intervention is a comp review plus a stretch assignment."
What the Warning Signs Look Like in Practice
Most service businesses collect the data above without ever joining it. Here is what joined data surfaces, drawn from real operator patterns.
The Stagnant Pay Pattern
A tech has been at the same wage for 14 months. Their review scores have held flat, not because they are bad, but because the owner has not built a pay progression path. The market moved on. The tech sees a posting for $2 more per hour across town. The model flags the wage gap and the tenure stall together. Recommended action: a comp review with a clear path forward, before the job board does the talking.
The Overtime Burnout Pattern
A tech who used to volunteer for weekend calls has stopped volunteering. Overtime hours have dropped 35% in two months. PTO balance has climbed to 80 hours unused. The model reads this as fatigue plus disengagement, not as a productivity problem. Recommended action: enforce PTO, reduce on-call rotation, and have a manager-led conversation about workload.
The Customer Drift Pattern
Callback rates per tech have climbed from 4% to 9% over the last quarter. Customer satisfaction scores for that tech's jobs have slipped. The tech is still showing up and still hitting the schedule, but the work is going sideways. The model flags this as a skill-fit or training-gap problem long before the tech formally disengages. Recommended action: targeted training, ride-alongs, or a role-fit review.
The Tenure Cliff Pattern
A tech crosses the 6-month or 18-month mark. The model weighs this against industry benchmarks, and the risk score jumps. These cliffs are where most voluntary quits happen. The intervention is structural: a clear 30-60-90 day plan for new techs, a 12-month check-in for tenured techs, and a 24-month growth conversation for anyone past the second cliff.
AnovaGrowth Operating Insight: The Data You Already Have Is the Model
The most common thing we hear from service business owners when we bring up retention scoring is some version of "we do not have the data for that." Then we open their CRM and their payroll export and their scheduling system, and within an hour we have 11 of the 12 inputs the model needs. The 12th is usually a simple sentiment scan of dispatch messages.
The point is not that you need a new system. The point is that the systems you have are not talking to each other. A retention model is mostly a data plumbing project with a thin prediction layer on top. That is good news, because it means the cost of building it is low and the time to value is weeks, not quarters.
What slows the project down is never the math. It is the conversation that follows. Once the model surfaces that your best tech is at risk because of a 14-month wage freeze, you actually have to do the wage review. The model is not the hard part. The hard part is acting on what it tells you, on time, with money and a plan.
How to Set Up AI Retention Scoring in 60 Days
A workable retention system does not require a data team. It requires three weeks of cleanup, three weeks of model setup, and a manager who runs the report every month and follows through on the playbook.
Days 1-15: Clean the Source Data
Pull the last 24 months of data from your CRM, scheduling system, payroll provider, and HR records. Standardize the fields the model needs.
- Tenure and role history. One row per tech per role, with start dates, end dates, and reason codes. Most payroll systems already track this. Most CRMs do not.
- Performance review scores. Either numeric or normalized text. If your reviews are narrative-only, add a 1-5 rating to every review going forward. The historical data will catch up over the next four quarters.
- Customer satisfaction per tech. Pull the last 200 jobs per tech and tag each with the post-job survey result or complaint flag. Most modern CRMs already link jobs to surveys.
- Overtime and PTO. Straightforward export from payroll. Make sure the export includes scheduled hours, worked hours, and PTO taken.
If the cleanup stalls here, do not push forward. A retention model on dirty data gives you confident-looking answers that are wrong. See the CRM data cleanup guide for the framework we use.
Days 16-35: Build the Baseline Model
Start with a simple logistic regression or decision tree on the data above. You do not need deep learning. You need the right features and clean labels. Labels are the quits you have already had. Pull the last 24 months of separations and tag each as voluntary or involuntary. Voluntary quits are what you are trying to predict. Involuntary separations (terminations, layoffs) are what you are filtering out.
The first model will look noisy. That is normal. The features that matter will surface quickly: tenure cliff, wage stagnation, overtime trend, callback rate, and review trajectory. Those five will get you 70% of the predictive power. The rest is refinement.
Days 36-60: Run It Monthly and Act
Set a monthly cadence. Run the score on the first business day of the month. The output is a ranked roster, the top three drivers per high-risk tech, and a recommended intervention category: comp review, workload adjustment, training, role fit, or tenure-cliff conversation.
The manager-led conversation is the deliverable. The score is just the prompt. Schedule the conversations in the first two weeks of the month and document the outcomes. You will know within two cycles whether the interventions are working because the next month's score will reflect the changes.
Common Mistakes When Setting Up Retention Scoring
The math is the easy part. The implementation is where most projects die.
Treating It as a Surveillance Tool
If techs find out the model is being used to track them into the ground instead of supporting them, the system will backfire. Frame it internally as a manager-support tool, not a watchlist. Techs do not need to see their individual score. They need to see that their manager has a plan for their growth.
Only Acting on the Top 3
A ranked roster invites the temptation to "only worry about the top 3." In practice, the middle of the roster is where most of the value is. The top 3 are usually already on the manager's radar. Techs ranked 5 through 15 are the ones who fall through the cracks and quit quietly. Include them.
Skipping the Wage Conversation
Most retention models flag wage stagnation as a top driver, and most owners avoid acting on it because money is uncomfortable. That avoidance is exactly why the techs quit. If the model says wage is the issue, address it. You do not have to match the market instantly, but you have to show a path.
Ignoring Involuntary Separations
Involuntary exits (terminations, performance exits) often look like voluntary quits in the data. If your training set mixes them, the model will misfire on high-performers who happen to take a lot of PTO. Tag them carefully. Voluntary-only labels matter.
Running the Model Once
A retention model trained on last year's data misses this year's signals. Re-run monthly, retrain quarterly, and recalibrate the feature weights whenever your business changes materially. New service line, new region, new pay structure, all of it shifts the weights.
How Retention Scoring Connects to the Rest of the Operation
Retention does not live in HR. It lives in the operating system. When you wire it into the rest of your data, the predictions get sharper and the interventions get cheaper.
- Workforce planning. Retention risk feeds into the same model your capacity planning uses. If two techs are at risk and your forecast shows a structural shortfall, you know to start recruiting now instead of in six weeks.
- Hiring pipeline. A high retention score on existing techs is a signal to open requisitions. Pair this with the automated hiring workflow so the pipeline is already warm when the resignation arrives.
- Training investment. A tech whose callback rate is climbing should be on the same training path your AI knowledge base recommends. Retention and skill development are the same conversation when you look at the data together.
- Compensation planning. Wage stagnation shows up in the retention model months before it shows up in the exit data. Tie the score into your annual comp cycle and you stop paying catch-up raises.
- Customer continuity. Customer satisfaction scores per tech are one of the most predictive features. Pairing retention data with the AI customer segmentation work helps you protect the customer relationships most at risk when a tech leaves.
When those connections are live, retention stops being a guessing game and starts being an operational discipline. You stop reacting to resignations and start preventing them.
Frequently Asked Questions About AI Technician Retention
How far ahead can the model predict?
For skilled trades, the strongest signal window is 60 to 120 days before a voluntary quit. Some signals (PTO cash-out, last-minute time off) show up inside 30 days, but by then the tech has usually already decided. The earlier signals are wage stagnation, review trajectory, and tenure cliffs. Aim to act on the 60-90 day window.
What if we have never tracked this data before?
Start now. You cannot go back and recreate historical reviews, but you can start tagging every interaction going forward. Most service businesses have 6-12 months of usable history in their CRM already. The first model will be noisy. By month 6, it is sharper than any human guess.
Does this work for small crews?
Yes, with caveats. A 5-tech shop does not have the statistical power a 50-tech shop has. The model will surface broad patterns (tenure cliff, wage stagnation) but the per-tech nuance is harder. For small crews, treat the score as one input among several and weight the manager conversation more heavily than the number.
Will techs see this as big brother?
How you frame it internally matters. We have never seen a tech quit because their employer asked how they were doing and offered training or a wage review. We have seen plenty of techs quit because nobody asked. Frame the system as support, not surveillance, and the cultural risk is low.
What is the ROI?
Most service businesses we work with see a 3-5x ROI on retention projects in the first year, measured as direct replacement cost avoided plus lost productivity avoided. The math improves every year you run it, because the model gets sharper and the manager muscle memory gets stronger.
How is this different from an employee survey?
Surveys are point-in-time and rely on techs being willing to be honest. AI retention scoring runs on operational data techs already generate and surfaces patterns they would not report in a survey. The two complement each other. Use the score to decide whom to talk to, then use the conversation to act.
Want to see what AI retention scoring would look like for your roster? Talk to AnovaGrowth about a 90-minute operations audit. We will pull your CRM, payroll, and scheduling exports, build a draft risk score for your top 10 techs, and show you where the early warning signs already are, before the next resignation catches you off guard.