The Week You Couldn't Find Techs and the Week You Couldn't Find Work
Every service business owner has lived both weeks. The peak week where three techs are out, calls are rolling to voicemail, and customers wait three days for a callback. Then the slow week where everyone is paid to ride around together and you start wondering why payroll is still 30% of revenue.
Both weeks are the same problem. You staffed for the average, and the average does not exist.
Capacity planning is the discipline that fixes this. It asks a simple question every week: given the work coming in, the work already on the books, and the crews I have available, am I over or under, and by how much? AI makes that question answerable in minutes instead of guessable after the fact.
Quick answer: AI capacity planning combines your CRM pipeline, booking history, seasonality, and crew skills into a 4 to 13 week forecast of labor demand. It maps forecast hours against available hours per crew, flags shortfalls or surpluses early, and recommends actions: cross-train, hire, contract out, or run maintenance work in the gap. The result is a crew plan that reduces overtime by 15-25%, protects margins in slow weeks, and lets owners stop reacting to next Tuesday and start planning next quarter.
Why "Average Demand" Is the Enemy of Service Business Capacity Planning
Most service businesses plan around a single number: average weekly revenue or average jobs per day. That number feels safe because it has historical weight. It is also almost always wrong for any given week.
Demand in service work is shaped by five forces that pull in different directions:
- Seasonality. HVAC peaks in summer and winter. Roofing peaks after storm seasons. Tax and legal work peaks in March and April. Pool service peaks in spring.
- Pipeline momentum. A surge in signed estimates three weeks ago shows up as install labor next week. If your CRM tracks close rate by source, you can forecast labor from pipeline.
- External signals. Local events, weather, permit cycles, and tourism calendars move demand. A NASCAR weekend in Charlotte or a hurricane warning in Florida shifts call volume overnight.
- Maintenance cadence. Recurring service contracts create predictable baseline hours. Miss the cadence and you create or destroy capacity in chunks.
- Marketing and promo spikes. A radio buy, a Google Ads push, or a local sponsorship will pull demand forward or backward in a way the average will never show.
Planning around the average means your actual week is either above or below your plan almost every week. Above drives overtime, callbacks, and customer complaints. Below drives low utilization, idle labor cost, and frustrated crews.
What AI Capacity Planning Actually Does
AI capacity planning is not a dashboard. It is a system that connects five data sources, runs a forecast, and turns it into action.
| Data Source | What It Tells the Model | Practical Use |
|---|---|---|
| CRM pipeline by stage and close rate | Future booked work | Forecast labor demand 4-13 weeks out |
| Historical job data (job type, hours, season) | Baseline demand pattern | Detect normal seasonality vs anomalies |
| Crew roster (skills, hours, availability) | Available capacity | Map supply against demand |
| Recurring service contracts | Predictable baseline load | Lock in floor hours per crew per week |
| External signals (weather, events, marketing calendar) | Demand modifiers | Adjust forecast for known surges |
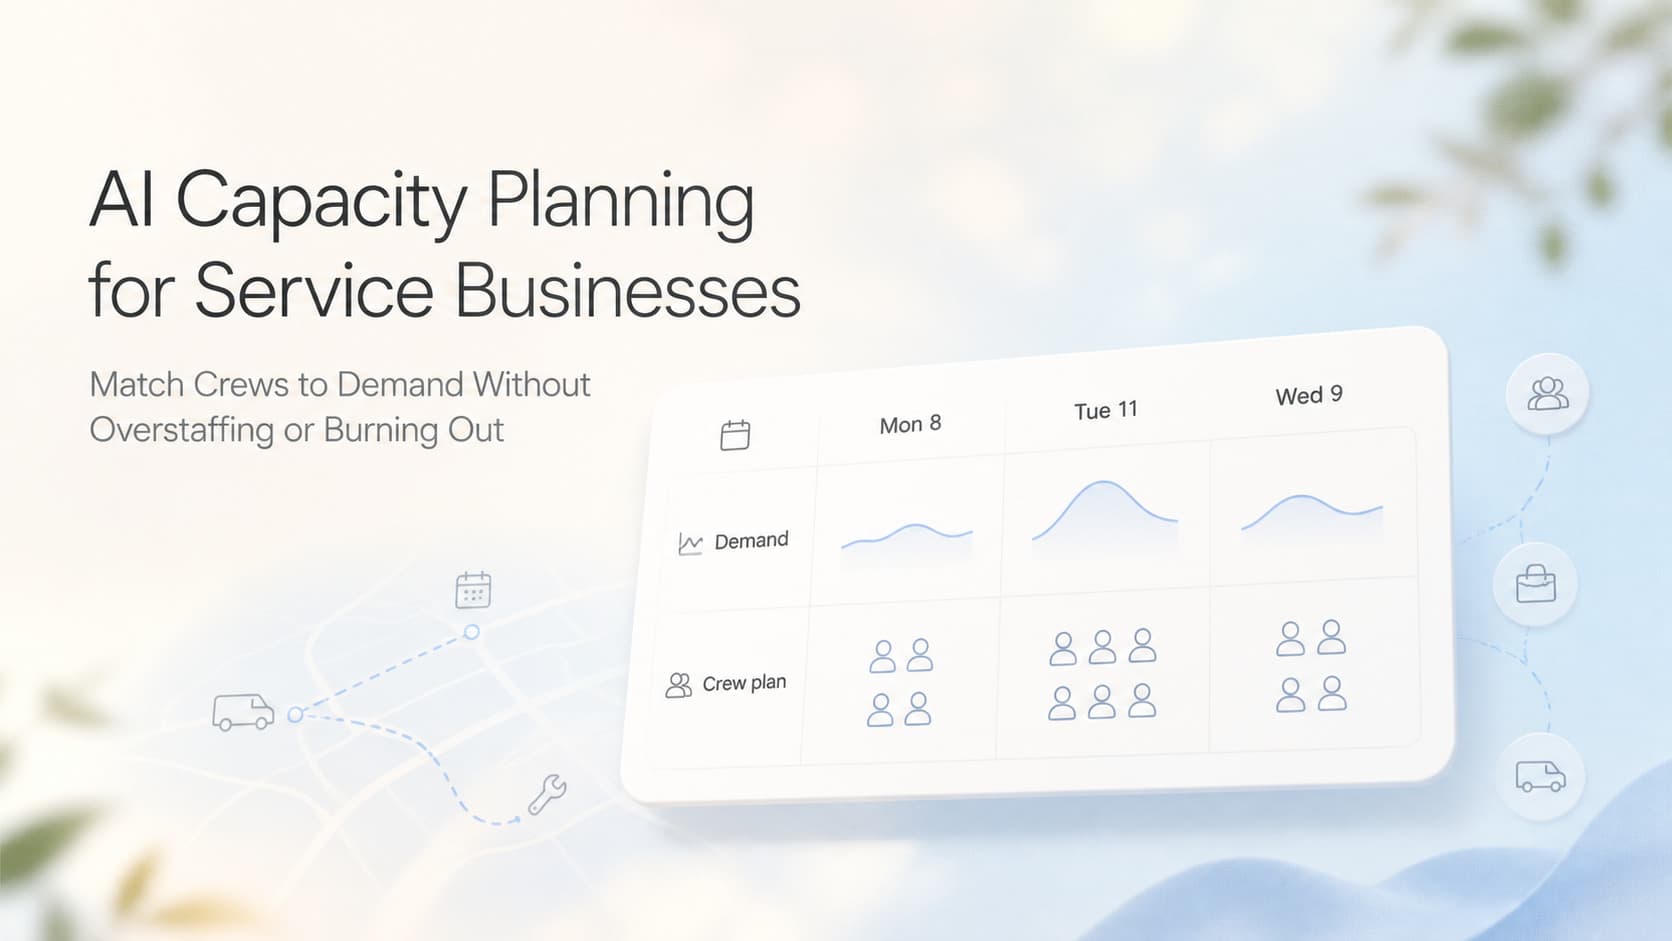
The output is a weekly view of forecast hours versus available hours, broken down by crew, skill, and job type. When the gap gets too wide in either direction, the system recommends an action.
Forecast vs Available Hours, Week by Week
The simplest version of the output is a chart with two lines:
- Forecast hours. Pulled from pipeline close rates plus historical seasonality plus external modifiers.
- Available hours. Pulled from crew roster, PTO, holidays, and average productive hours per tech.
The space between the lines is your action zone. Green space means you have room to sell. Red space means you need to hire, cross-train, or pull from another region.
Skill-Level Capacity, Not Just Headcount
A crew of five techs is not five units of capacity. It is a mix of skills, certifications, and tenure. If your gas line certified tech is on vacation and you have three gas line jobs booked, you have a shortfall no matter how many apprentices are sitting idle.
AI capacity planning models capacity at the skill level, not the headcount level. That is the difference between knowing you have five techs and knowing you have 1.4 gas line equivalents available next Tuesday.
Recommended Actions
When the model sees a gap, it does not just raise a flag. It recommends one of five actions:
- Cross-train. Bring a second tech up to speed on a constrained skill before the peak week.
- Subcontract. Identify which jobs to hand to a trusted sub when shortfall is short-term.
- Hire. When the gap is structural and forecast to persist 8+ weeks, hiring is the right answer.
- Push demand. Run a maintenance special, a slow-season promo, or a marketing push into a surplus week.
- Schedule strategically. Stagger PTO, move training into slow weeks, or front-load non-revenue work when capacity is high.
That last step is where most service businesses fail. They do not have a plan for the surplus week. AI surfaces it early enough to do something useful with it.
How to Build a Capacity Plan in 90 Days
A working capacity plan does not need a data team. It needs four weeks of clean setup, eight weeks of model training, and one owner who reviews the forecast every Monday.
Weeks 1-2: Get the Data Clean
Pull the last 24 months of data from your CRM, scheduling tool, and payroll system. You are looking for:
- Job type, hours billed, hours actual, crew assigned, date completed.
- Close rate by source, average days from estimate to booking.
- Crew roster with skills, certifications, PTO history, productive hours per week.
If your CRM is messy, this is where the project stalls. Run a CRM data cleanup first. The model is only as good as the data feeding it.
Weeks 3-4: Build the Baseline Forecast
Start with three numbers per job type:
- Average hours per job. Median across the last 24 months, with outliers removed.
- Average weekly volume by month. Pulled from history, adjusted for known seasonality.
- Pipeline conversion rate by source. Google Ads leads close at a different rate than referrals. Your forecast should know that.
Multiply them. Now you have a baseline forecast of weekly labor demand by job type.
Weeks 5-8: Layer External Signals
Add the modifiers:
- Weather forecasts for the next 13 weeks (heating degree days, cooling degree days, storm probability).
- Local event calendar (conventions, sports, school calendars, tourism peaks).
- Marketing calendar (campaigns running, expected lift per channel).
- Maintenance contract schedule (which customers are due for service in which week).
This is where AI adds the most value over a spreadsheet. It can ingest thousands of these signals and learn which ones actually move demand for your specific business, instead of treating every signal as equally important.
Weeks 9-12: Map Supply and Run Weekly
Once the model has 8 weeks of learning, run it every Monday morning. Review the 13-week rolling view. Look for the first week where forecast hours exceed available hours by more than 10%, or fall below by more than 20%. Those are your action weeks.
The first month of running this, you will find mistakes. The model over-forecasted a slow week, or under-forecasted a service contract renewal. Adjust, retrain, and rerun. By week 12, the forecast is closer than any human estimate.
What This Looks Like at a Real Service Business
AnovaGrowth ran a capacity planning build for a residential HVAC company in the Southeast with 14 techs across two locations. Before the build:
- Overtime averaged 9% of total labor cost, peaking at 18% in summer.
- Slow weeks in February and November averaged 62% crew utilization.
- The owner was making hiring decisions based on gut feel, three months after he should have made them.
After 90 days of running AI capacity planning:
- Overtime dropped from 9% to 5.8% of labor cost. That is roughly $140,000 in annual savings at their crew size.
- Slow-week utilization rose from 62% to 78% by front-loading maintenance contracts and training into February.
- The owner hired two techs in March based on a forecast that showed a structural shortfall starting in May. Both were productive by peak week instead of scrambling in July.
The forecast was not magic. It was the same data the owner already had, organized so it could answer a question he could not answer before: how many hours of which skill do I need next month, and what is the cheapest way to get there.
Common Mistakes When Setting Up AI Capacity Planning
Most capacity planning projects stall for the same reasons. Skip these traps.
Treating It as a One-Time Project
A capacity model is not something you build once. Demand patterns shift, crew composition changes, and new service lines get added. The model needs to be retrained quarterly and reviewed weekly. If you are not looking at the forecast every Monday, you are not capacity planning, you are making a spreadsheet.
Forecasting Only Revenue
Revenue forecasting and labor forecasting are different problems. A high-revenue week can still be a low-margin week if the work is warranty, callback, or low-margin install. Forecast hours by job type, not dollars by month.
Ignoring Skill Constraints
Headcount planning is easier than skill planning, which is why most owners do it. The week you lose your only backflow-certified tech and have three backflow tests scheduled is the week you wish you had planned at the skill level.
Forgetting the Slow Weeks
Surplus capacity is a problem too. Slow weeks eat margin because labor cost is mostly fixed. AI capacity planning surfaces them early enough to fill them with maintenance contracts, training, or strategic marketing pushes. A surplus week you saw coming is a profitable week. A surplus week you did not see coming is a write-down.
Hiding the Forecast from the Crew
Capacity planning works best when techs and dispatchers can see it. When the team understands that July is going to be slammed and February is going to be quiet, they plan their PTO better, take fewer unplanned days off, and help solve the gap instead of being victims of it.
How This Connects to the Rest of Your Operations
Capacity planning is most valuable when it is connected to the rest of your operation, not siloed in a spreadsheet.
- Pipeline data drives the forecast. Clean CRM data is the foundation. If your pipeline stages are inconsistent, your forecast will be too. See CRM data deduplication and hygiene for the cleanup framework.
- Scheduling software consumes the forecast. The forecast tells you how many tech-hours you need. The scheduler fills them. Without a clean handoff between the two, the forecast stays academic. Pair this with automated employee scheduling to operationalize it.
- Revenue forecasting is the companion view. Labor and revenue forecasts should agree. If they do not, one of them is wrong, and that is the first place to look when actuals come in off-plan. See AI sales forecasting for service businesses for the revenue side.
- Seasonality modeling gives the forecast its shape. Your average is just a midpoint between peaks and troughs. Plan against the actual curve. See seasonal demand planning for the patterns that matter.
- Hiring decisions should be the last step, not the first. Most owners hire because this week was rough. The forecast tells you whether next quarter will be rougher, and whether hiring, cross-training, or subcontracting is the right answer.
When those five connections are live, capacity planning stops being a planning exercise and starts being an operating system. You stop asking "do I need more people" and start asking "where in the next 13 weeks does my plan break, and what is the cheapest fix".
Frequently Asked Questions About AI Capacity Planning for Service Businesses
How far out should I forecast?
For crew decisions, 4 to 13 weeks is the sweet spot. Shorter than that and you cannot act on it (hiring takes 6-10 weeks, cross-training takes 4-6). Longer than that and the signal-to-noise ratio collapses. Use a 13-week rolling view refreshed every Monday.
What if my data is messy?
Fix it first. Capacity planning on dirty data is worse than no plan, because it creates a false sense of precision. Run a CRM cleanup, standardize your job types, and reconcile crew hours before you start. Most projects need 2-3 weeks of cleanup before the model can be trusted.
Does this work for small crews?
Yes, but the math is different. A 3-tech shop has fewer degrees of freedom. Cross-training is cheaper than hiring. Subcontracting is often the right answer for short surges. The forecast still matters, just the action set is smaller.
What tools do I need?
Most service businesses can run a workable capacity plan with the CRM, scheduling tool, and spreadsheet they already have. The AI layer sits on top: a forecasting model that ingests your exports and produces a weekly view. Tools like Python notebooks, Google Sheets with AI add-ins, or platforms like ServiceTitan plus a forecasting layer all work. The tool matters less than the discipline of running it weekly.
How is this different from seasonal demand planning?
Seasonal planning answers "when are my peaks and troughs." Capacity planning answers "given those peaks and troughs, how should I staff, schedule, and act to stay profitable in both?" Seasonal is the input. Capacity is the operating plan.
Want to see what AI capacity planning would look like for your business? Talk to AnovaGrowth about a 90-minute operations audit. We will pull your historical data, build a draft forecast, and show you where your next two quarters actually break, before you spend money on hiring or training you might not need.