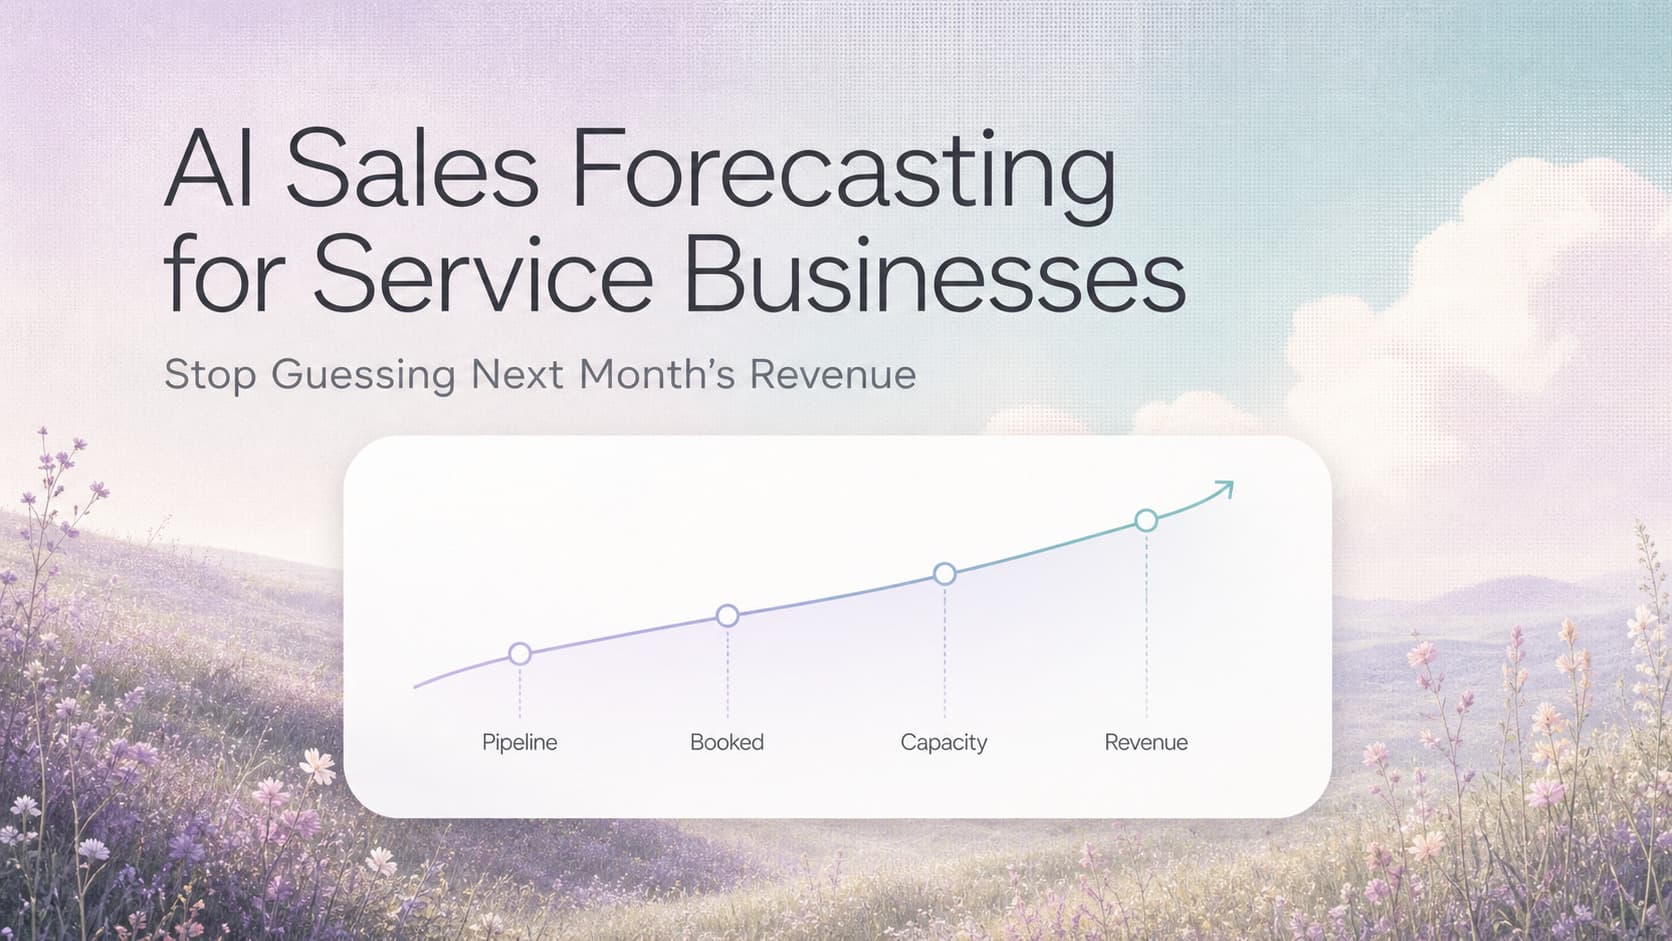
Quick answer: AI sales forecasting uses your CRM history, quote data, lead source, and seasonal patterns to predict three numbers every service business needs: which deals will close, how much revenue lands next month, and how many techs you need on the schedule. Plain spreadsheet forecasts are off by 30-40% on average. AI-driven forecasts hit 85-92% accuracy within a quarter once you have clean CRM data. The system is not magic. It is a pipeline-scoring model, a revenue model, and a capacity model wired together and updated weekly.
Why Service Business Forecasts Are Wrong by Default
Service business owners all run on a forecast. The problem is that the forecast is usually a gut feeling dressed up as a spreadsheet.
The classic version goes like this. The owner pulls last month's revenue, adds the deals they think are "definitely closing," adjusts for the season, and announces a target. Sometimes the number lands within 10%. Often it misses by 25-40%. The owner's confidence in the forecast drops. The team stops trusting it. Decisions about hiring, ad spend, and inventory get made on instinct instead.
Three reasons service business forecasts miss by default:
The forecast is built on guesses, not data. Most service businesses do not tag their pipeline stages consistently. A "qualified" deal in the CRM might mean "the customer said they would think about it" or "the customer signed the contract" depending on which salesperson logged it. The forecast add up nonsense.
The forecast ignores what already shipped. A service business's forecast is only as good as its close rate. If you win 35% of your quotes and you are forecasting next quarter on 100 open quotes, you should expect 35 closed deals, not 100. Most forecasts do not apply this discount.
The forecast freezes for too long. A forecast built in January and reviewed in March is a historical document, not a planning tool. Conditions change. Lead sources shift. A competitor opens across town. The forecast has to refresh weekly to be useful.
AI fixes each of these three problems at the same time. It does not replace judgment. It gives the judgment better inputs.
What AI Forecasting Actually Does
AI sales forecasting is not a black box that spits out a number. It is a layered system that turns your existing CRM, quote, and scheduling data into three forecasts that drive decisions.
The Three Forecasts Every Service Business Needs
| Forecast | Question It Answers | Use Case |
|---|---|---|
| Pipeline forecast | Which open deals will close this month, and at what value | Cash flow planning, weekly team standup |
| Revenue forecast | What total revenue lands next month and next quarter | Hiring, ad spend, equipment purchases |
| Capacity forecast | How many tech hours are needed to deliver the forecast | Scheduling, hiring pipeline, inventory |
Most service businesses have none of these. The lucky ones have one. The well-run ones have all three, refresh them weekly, and use them to drive decisions instead of gut feel.
How the AI Forecast Beats the Spreadsheet Forecast
| Driver | Spreadsheet | AI Forecast |
|---|---|---|
| Win rate per stage | Owner picks a round number | Computed from last 6-12 months of CRM data |
| Seasonal adjustment | One multiplier for the year | Month-by-month adjustment by service type |
| Lead source quality | Ignored | Weighted by historical close rate |
| Deal aging | Dropped after 30 days | Flagged for follow-up, written down |
| Quote value | Counted in full | Weighted by stage probability |
| Tech capacity | Owner estimates | Computed from scheduling data |
| Update frequency | Monthly or quarterly | Weekly with new data |
A spreadsheet forecast treats every deal as the same. An AI forecast treats every deal as a probability that depends on its stage, source, age, value, and the salesperson working it. The difference between the two approaches is the difference between a $1.4M forecast that lands at $1.05M and a $1.1M forecast that lands at $1.06M.
The Pipeline Forecast: Scoring Every Deal
The pipeline forecast is the most valuable forecast for most service businesses. It tells you which deals are most likely to close and which ones are stuck.
Win Probability Scoring
Every open deal in your CRM gets a score from 0 to 100 that represents the probability it closes. The score is computed from signals you already have.
Signals that predict wins:
- Days in current stage (older than 30 days = lower score)
- Lead source (referrals and repeat customers score higher than cold web leads)
- Quote value relative to the customer's average ticket
- Number of touches (calls, emails, texts) logged on the deal
- Customer response rate (replied within 24 hours vs. ghosted)
- Quote revisions (more than 2 revisions often signals budget issues)
- Customer in the same zip code as your top existing customers
- Job type (services you have historically won at high rates)
The score updates every time the deal changes. The CRM shows the salesperson where to spend the day. The manager sees a weighted forecast that adds up the score, not the deal value.
Forecast Categories
Sort the open pipeline into four buckets based on the win probability:
| Bucket | Win Probability | Forecast Treatment |
|---|---|---|
| Commit | 80-100% | Count full value in forecast |
| Best Case | 60-79% | Count 50% of value in forecast |
| Pipeline | 40-59% | Count 25% of value in forecast |
| Watch | 0-39% | Do not count, but do not delete |
A salesperson with 20 deals in the pipeline and 8 in Commit is a stronger forecast than a salesperson with 20 deals and 2 in Commit, even if the average deal value is the same. The AI scores make that distinction visible.
The Revenue Forecast: Predicting Next Month and Next Quarter
The revenue forecast combines the pipeline forecast with historical close rates, seasonal multipliers, and lead flow to predict what will actually land in the bank.
The Inputs the Model Uses
- Open pipeline weighted by win probability
- Average monthly close rate by job type and lead source
- Seasonal multipliers (your slower months have lower conversion rates baked in)
- Lead volume (you cannot close what is not in the pipeline)
- Average ticket size trend (prices usually drift up over time)
- Marketing spend and source mix
The output is a revenue forecast for next month, next quarter, and the next 12 months. The forecast comes with a confidence interval. A 90% confidence interval means the model is 90% sure revenue lands inside the range. A 50% confidence interval is a wider band but more honest.
Why Confidence Intervals Matter
Owners hate confidence intervals at first. They want one number. The problem is that one number is a lie. A forecast that says "next month will be $340K" with no range is hiding the uncertainty. A forecast that says "next month will be $310K to $370K with 80% confidence" is honest.
The confidence interval also tells you what to do. If the wide range is $280K to $400K, the model is uncertain. That usually means the pipeline is thin or the lead flow is unsteady. The fix is to pour more leads into the funnel, not to refine the model.
Forecast vs. Actual: The Feedback Loop
The single most important discipline in sales forecasting is the forecast-vs-actual review. Every Monday, compare last week's forecast to actual closed revenue. Every month, compare the rolled-up forecast to actual closed revenue.
The variance is the teaching signal. If the forecast is consistently 15% high, the win probabilities are too optimistic. If the forecast is consistently low, the model is being too conservative. If the forecast is accurate on average but volatile week to week, the problem is lead flow, not the model.
Run the review with the sales team every week. The team learns how the model behaves. The model learns from the team's overrides. The forecast gets sharper every quarter.
The Capacity Forecast: How Many Techs You Need
The capacity forecast is the boring forecast that nobody runs until it is too late. It is also the forecast that decides whether you make money on the jobs you are forecasting.
The Inputs
- Forecasted revenue by job type
- Average job duration by job type
- Available tech hours per week (working hours minus PTO, training, drives)
- Tech skill mix (qualified for which job types)
- Geographic constraints (techs can only run certain routes)
The output is a weekly capacity requirement: how many tech hours you need in each role, in each zone, in each week.
If the capacity forecast says you need 18 techs next month and you have 14, you have a hiring problem. The choice is to hire 4 techs, lose 4 jobs a month, or miss the revenue forecast. Wishing does not change the math.
Why Capacity Forecasting Is Where the Money Lives
Pipeline forecasting and revenue forecasting are good for cash flow and planning. Capacity forecasting is good for profit. The service businesses that run this forecast catch the capacity gap before they over-promise delivery dates and burn out the team.
The capacity forecast also flags under-utilization. If your 14 techs are running at 60% utilization next month, the revenue forecast is soft. The fix is to push marketing harder, not to hire techs you don't need.
Building the Forecast in 90 Days
You can stand up a working AI sales forecast in 90 days without a data team. The roadmap below is the one we use with most AnovaGrowth clients.
Days 1-15: Clean the CRM
The forecast is only as good as the data. Before the model runs, the data needs to be consistent.
- Standardize pipeline stages across the team. Five stages max: New, Qualified, Quoted, Negotiating, Closed.
- Tag every won and lost deal with a clear outcome. No "still in talks" after 60 days.
- Capture lead source on every deal. This is the single most important field for forecasting.
- Capture job type and quote value on every deal.
- Capture the close date on every closed deal, even if it is approximate.
If you skip this step, the model will be wrong. There is no AI fix for messy data.
Days 16-45: Build the Pipeline Forecast
Once the data is clean, build the pipeline forecast first. It is the easiest to validate and the most immediately useful.
- Compute historical win rates by stage, source, and job type.
- Apply those win rates to the open pipeline as deal weights.
- Display the weighted forecast alongside the raw pipeline value.
- Train the sales team on the four buckets (Commit, Best Case, Pipeline, Watch).
- Run a weekly forecast call. The team reports what they expect to close, the model scores it, the manager compares the two.
You will see disagreement between the team and the model. That is the point. The disagreements are the teaching moments. After 6-8 weeks, the team and the model converge because the team learns how the model scores and the model learns where the team adjusts.
Days 46-75: Build the Revenue Forecast
Once the pipeline forecast is working, layer in the revenue forecast.
- Pull the last 18-24 months of closed deals.
- Compute monthly close rates and seasonal multipliers.
- Build a simple model that takes the open pipeline, applies the win probabilities, and adds the historical monthly run rate.
- Output a 1-month, 3-month, and 12-month forecast with confidence intervals.
- Run the weekly forecast-vs-actual review. Track the variance.
The model does not have to be fancy. A simple time-series model with seasonal adjustment, layered on top of the pipeline forecast, beats most spreadsheets. If you have a data analyst or a consultant, they can build this in a week.
Days 76-90: Build the Capacity Forecast
The capacity forecast is the last layer because it depends on the first two.
- Map every job type to an average duration.
- Subtract drive time, training, and PTO from weekly available hours.
- Output a weekly capacity requirement by role and zone.
- Compare to current staffing. Flag gaps and surpluses.
- Feed the gaps back into the revenue forecast (you cannot hit the revenue forecast without the capacity).
Most service businesses discover at this stage that they are either overstaffed (revenue is soft) or understaffed (revenue is hard to hit). Both insights are valuable. The forecast just makes them visible.
The Tools That Run This
You do not need to build models from scratch. The tools below stack for a service business running $1M to $25M in revenue.
| Layer | Cost-Effective Tools | Higher-End Tools |
|---|---|---|
| CRM | HubSpot, HighLevel, Jobber | Salesforce, ServiceTitan |
| Pipeline scoring | Built-in CRM scoring, custom fields | MadKudu, sixsense, custom ML |
| Revenue forecasting | Spreadsheet + forecasting macros | Pigment, Mosaic, Anaplan |
| Capacity forecasting | Scheduling tool with reported utilization | Float, Runn, ResourceGuru |
| Data warehouse | Airtable, Google Sheets | Snowflake, BigQuery |
| AI/ML layer | GPT-4o, Claude, custom prompts | AWS Forecast, Google Vertex AI |
For most service businesses doing $1M to $10M, the right stack is HubSpot or HighLevel for the CRM, a custom forecasting field on every deal, a Google Sheet with the model, and a Float or similar tool for capacity. Total cost runs $300 to $1,500 per month.
For service businesses doing $10M to $25M, the right stack is Salesforce or ServiceTitan, a dedicated pipeline scoring tool, a planning tool like Pigment, and a properly modeled capacity layer. Total cost runs $3,000 to $10,000 per month.
The right stack depends on the size of the business and the maturity of the data. Start cheap, prove the discipline, upgrade when the model is worth more than the cost.
Proof It Works: A $6M Commercial HVAC Company in Birmingham
A commercial HVAC company in Birmingham with 22 techs was running on a spreadsheet forecast the owner had built three years earlier. The forecast missed by an average of 32% every quarter. The owner was scared to hire because the forecast kept saying revenue was going to spike, then it did not. The team was burnt out from over-promising delivery dates.
The owner engaged AnovaGrowth to build a working AI sales forecast.
What we found in the CRM:
- 47% of open deals had no close date
- 62% of open deals had no lead source
- Pipeline stages had 14 different names across the team
- The historical close rate was 28% but the forecast assumed 45%
What we built in 90 days:
- Cleaned the CRM, standardized the pipeline to 5 stages, made lead source and close date required
- Built a pipeline score on every deal using historical close rates by stage, source, and job type
- Built a monthly revenue forecast with seasonal adjustment and a 12-month rolling view
- Built a capacity forecast that flagged a 3-tech gap in the commercial install team for Q4
- Ran a weekly forecast call with the sales team
Results after 6 months:
- Forecast accuracy went from 68% to 91% on a rolling 90-day basis
- Forecast variance dropped from 32% average to 8% average
- Owner hired 4 techs in Q4 against a confirmed capacity gap, instead of hiring 0 techs and missing the forecast
- The team stopped over-promising delivery dates because the capacity forecast was visible upfront
- The owner stopped second-guessing the marketing budget because the forecast tied back to lead volume
- Gross margin rose 4.2 points because the team stopped taking low-margin jobs to fill the calendar
The system is not magical. It is a clean CRM, a simple model, and a weekly forecast review. The owner ran the same business for 18 years before the forecast. He runs the same business now, but with eyes on the next 90 days.
What This Connects to the Rest of Your Operations
A sales forecast is most powerful when it shares data with the systems around it. The forecast that calls for 4 new techs needs to talk to the hiring pipeline. The forecast that assumes 28% close rate needs to talk to the lead generation engine. The forecast that flags a 3-tech gap needs to inform the equipment purchase plan.
If your CRM is full of stale data, CRM Pipeline Management for Service Businesses covers the discipline of keeping the pipeline clean enough to forecast against.
If you are losing jobs because your quotes are off, Quote Win Rate Analysis for Service Businesses shows how to use quote data to find the pricing and follow-up gaps.
If you need to plan hiring and capacity against the forecast, Service Business KPIs Beyond Revenue walks through the metrics that pair with the forecast to give you the full operational picture.
If the forecast is telling you that revenue is going to spike and you cannot hire fast enough, Automated Hiring and Onboarding for Service Businesses covers how to compress the hiring cycle from 60 days to 25.
Related Questions and Subtopics
- What is AI sales forecasting for a service business? It is the practice of using CRM history, quote data, lead source, and seasonal patterns to predict which deals will close, how much revenue will land next month, and how many techs you need on the schedule. Plain spreadsheet forecasts are off by 30-40%. AI-driven forecasts hit 85-92% accuracy within a quarter.
- How accurate should a sales forecast be? A forecast with 90% confidence interval should land within 10% of actual revenue. Anything below 80% accuracy usually means the CRM data is messy or the model is not being updated weekly. Tracking forecast variance over time is the right way to measure accuracy.
- What is win probability scoring? Every open deal gets a score from 0 to 100 based on signals like stage, source, age, value, and response rate. The score is multiplied by the deal value to create a weighted forecast. Deals over 80 are likely to close. Deals under 40 are stuck or dead.
- How is AI forecasting different from spreadsheet forecasting? A spreadsheet treats every deal as the same. AI forecasting weights each deal by its historical probability of closing based on the same signals. Spreadsheets also miss seasonal patterns and lead source differences that the model picks up automatically.
- What data do I need to start AI sales forecasting? At minimum: 12 months of closed deals with stage history, lead source, job type, quote value, and close date. The more data you have, the more accurate the model. Most service businesses can start with 6 months of data and improve as the model learns.
- How often should the forecast be updated? Weekly is the right cadence for most service businesses. Daily is too much noise. Monthly is too slow to catch pipeline changes. The forecast call takes 20-30 minutes when the data is clean.
- What is the difference between pipeline forecasting and revenue forecasting? Pipeline forecasting predicts which deals will close and when. Revenue forecasting predicts total revenue for a period. Pipeline forecasting is the input. Revenue forecasting is the output.
- How do I hire against the forecast? Run the capacity forecast. If the forecast says you need 18 techs next quarter and you have 14, start hiring 4. If the forecast says you need 14 and you have 18, hold hiring and focus on utilization. The forecast drives the hiring plan, not the other way around.
AnovaGrowth Operating Insight
The forecasts that fail are the forecasts that nobody trusts. The forecasts that succeed are the forecasts the team argues with and then watches prove itself. The argument is the feature. Every Tuesday at our clients, the sales team meets for 30 minutes, looks at the AI forecast, and argues about the deals the model has marked as 80% likely to close. The argument exposes the factors the model does not know about yet. Those factors get baked into the next version of the model. After 6 months, the team and the model agree on 80% of deals and disagree on 20%. The 20% they disagree on is where the company makes decisions that matter. That is the operating rhythm that makes AI forecasting an operating system, not a dashboard.
Key Takeaways
- Spreadsheet forecasts are off by 30-40% on average. AI forecasts hit 85-92% accuracy within a quarter.
- The three forecasts every service business needs: pipeline, revenue, and capacity.
- Win probability scoring is the foundation. Every deal gets a score from 0 to 100 based on stage, source, age, and value.
- Confidence intervals matter more than point estimates. A $310K to $370K forecast with 80% confidence is more honest than "$340K, definitely."
- The weekly forecast-vs-actual review is the discipline that makes the model sharper.
- Capacity forecasting is where the profit lives. The forecast that flags a 3-tech gap in Q4 is the forecast that prevents over-promising delivery dates.
- You can stand up a working AI forecast in 90 days without a data team.
- A Birmingham HVAC company lifted forecast accuracy from 68% to 91% and hired 4 techs with confidence against a confirmed gap.
Next Steps
The fastest way to start is to pull your last 90 days of closed deals from your CRM and tag each one with the lead source, job type, and the stage it was in when it closed. That gives you the historical data to build the win probability model. Then add the win probability field to your open pipeline and run a weekly forecast call for 8 weeks. The model and the team will converge. The forecast will get sharper. The decisions will get easier.
If you want help building the pipeline score, the revenue forecast, and the capacity model, wiring them into your CRM and scheduling tools, and running the weekly forecast review that turns the model into an operating rhythm, contact us for a 30-minute sales forecast review. We will map your CRM data, draft the scoring model, and outline the integrations you need to hit 90% forecast accuracy within the next 90 days.
Ready to stop guessing and start forecasting? Contact us and we will build the pipeline score, revenue model, and capacity forecast that turns your CRM data into a 90-day operating plan.