AI Profit Optimization for Service Businesses: Find the Money You Don't See
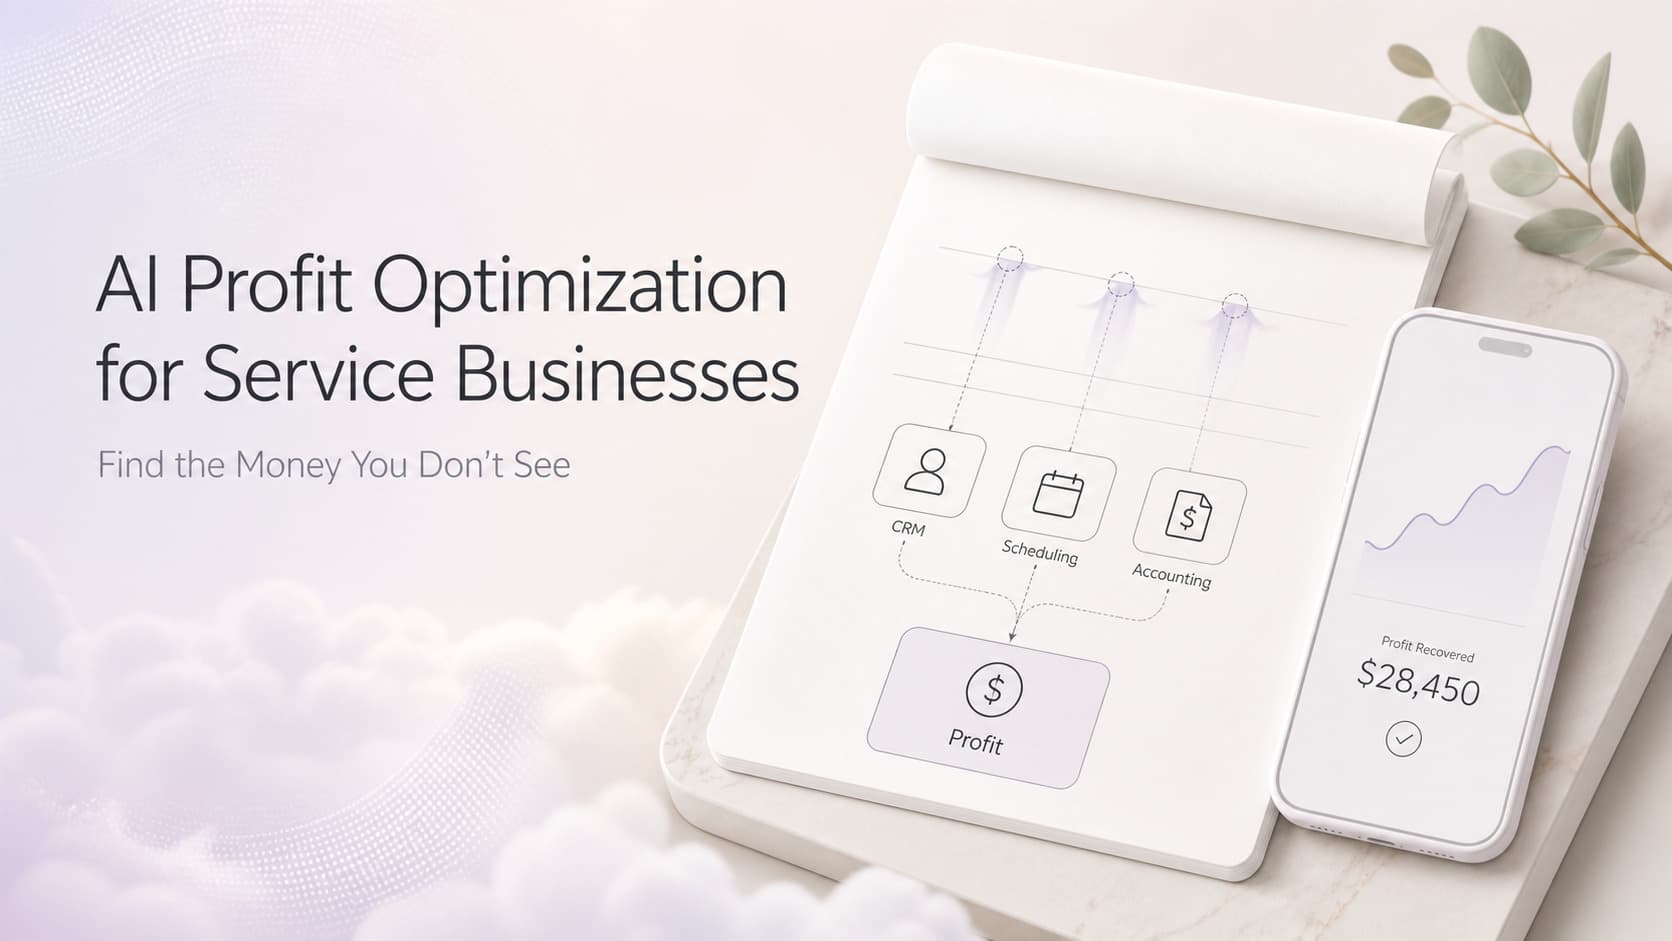
Most service businesses lose 10-30% of profit to silent money drains. AI profit optimization joins your CRM, scheduling, and accounting to surface them.

Quick Answer
AI profit optimization for service businesses is the practice of using AI to analyze operational data across your CRM, scheduling, job costing, and billing tools, then surface the specific money drains you cannot see in any single report. Most service businesses lose 10 to 30 percent of potential profit each year to silent drains: missed upsells, slow collections, underpriced jobs, dispatch waste, technician idle time, and customers who quietly churn. AI connects the dots between systems, ranks the drains by dollar impact, and points to the one or two fixes that pay back fastest. This guide covers the seven drains we see most often, the data needed to find them, and a four-step rollout you can run in under 30 days.
Why Most Service Businesses Bleed Money Without Realizing It
If you ask a service business owner what their top three profit problems are, you usually get the same three answers: slow collections, low close rates, and rising labor costs. Those are real. They are also the visible problems. The invisible ones are where the money actually hides.
A typical 20-person service business running on a modern CRM, a scheduling tool, and QuickBooks has thousands of new data points flowing through it every week. Job notes, quote histories, technician routes, payment dates, parts used, customer communication logs. None of this data lives in one place. None of it gets joined together. None of it gets analyzed for patterns that point to profit leaks.
That is the gap AI profit optimization fills.
A field tech who averages 4.2 billable hours per 8-hour shift is a drain. A job type that gets quoted 18 percent below the market median is a drain. A customer segment that buys once and never returns is a drain. None of these show up in a single dashboard. AI finds them by joining the data your tools already collect.
What the math looks like: A service business doing $4M in annual revenue with a 12 percent net margin clears $480K. If silent drains are eating 15 percent of potential profit (the lower end of what we see in client audits), the business is leaving $86K on the table each year. Most of that is recoverable in 6 to 12 months with the right visibility.
The Seven Profit Drains We See Most Often
Across service business audits we have run, seven drains account for the bulk of recoverable profit. Here is what they look like, in the order they tend to show up.
1. Missed Upsells and Cross-Sells
The classic example: an HVAC tech finishes a $4,200 system replacement and never mentions the maintenance plan, the smart thermostat, or the duct cleaning. The customer would have bought all three. The tech moved on to the next job.
How AI spots it: AI compares what was quoted on similar jobs in the past against what was actually sold. If the close rate on add-ons is below 35 percent, AI flags the gap and ties it to specific techs or job types.
2. Slow Collections and Aged Receivables
Most service businesses track invoices. Few track the age distribution of unpaid invoices by customer type or job type. Some customers pay in 9 days on average. Others pay in 64. The second group quietly costs you float, bad-debt write-offs, and time spent chasing.
How AI spots it: AI clusters customers by payment behavior, surfaces the segments with the slowest payment cycles, and ties the gap to specific job types, sales reps, or contract terms.
3. Underpriced Job Types
A plumbing company might price drain cleaning aggressively to win the call, then lose margin on every job because the labor estimate was off by 20 minutes. Across 600 jobs a year, that 20-minute gap is real money.
How AI spots it: AI joins job costing data with quoted-versus-actual hours, flags job types where actuals consistently overrun estimates, and recommends a price or estimate revision.
4. Dispatch and Routing Waste
Two techs in the same zip code driving 40 minutes between jobs is dispatch waste. AI can read route history and propose cluster assignments that cut windshield time without sacrificing response times.
How AI spots it: AI clusters completed jobs by zip code and time of day, surfaces routes with overlapping coverage, and recommends assignments that consolidate territory.
5. Technician Idle Time and Underutilization
A tech with a 55 percent utilization rate is paid for 100 percent of their time. The gap is paid labor that does not earn revenue. AI can read scheduling data and identify which techs are underutilized and why.
How AI spots it: AI joins scheduling data with job duration data, flags techs whose billable hours fall below 70 percent of paid hours, and ties the gap to specific reasons (training gaps, slow job types, geographic imbalance).
6. Customer Churn Without Recovery
Service businesses lose 20 to 40 percent of customers every year to churn. Most of those customers send zero warning signal before they leave. AI can detect the early signals (missed appointments, slower response times, fewer service calls) and trigger a recovery workflow before they ghost.
How AI spots it: AI scores customer activity over rolling 90-day windows, flags accounts that match a churn pattern, and routes them to a re-engagement sequence.
7. Quote-to-Cash Cycle Drag
Every day between sending a quote and getting paid is a day your business is funding the customer's project. AI can identify quotes that are stalling, recommend follow-up timing, and flag pricing or contract terms that correlate with longer cycles.
How AI spots it: AI tracks the age of every open quote, correlates quote age with close rate, and surfaces the specific quote formats, price points, or sales reps associated with the longest cycles.
The Four-Step AI Profit Optimization Rollout
You can run this in 30 days if you already have a CRM, scheduling tool, and accounting system. The goal is to surface the top three profit drains by day 14 and ship the first fix by day 30.
Step 1: Connect Your Tools
Pick an AI analytics layer that reads from your existing systems. The most common stack for service businesses:
| Tool | Data You Get | Common Use |
|---|---|---|
| CRM (HubSpot, ServiceTitan, Jobber) | Customer history, quotes, jobs | Close rate, churn signals |
| Scheduling (ServiceTitan, Housecall Pro) | Tech routes, job duration, dispatch | Utilization, routing waste |
| Accounting (QuickBooks, Xero) | Invoices, payments, job costing | Collections, job margin |
| Communication (email, SMS) | Customer messages, response times | Consistency, churn signals |
The connection is usually a no-code integration through Zapier, Make, or native connectors. The data does not need to be perfect. It needs to be flowing.
Step 2: Define Your Baseline Metrics
Before AI can flag a drain, it needs a baseline. Five metrics cover most of the surface area:
- Gross margin by job type (target: 35 percent or higher)
- Average quote-to-cash cycle (target: under 21 days)
- Upsell close rate by job type (target: 35 percent or higher)
- Technician utilization (target: 75 percent or higher)
- Customer payment cycle (target: under 30 days)
Write these down. AI will use them as the comparison baseline.
Step 3: Run AI Analysis
This is where AI does what spreadsheets cannot. The goal is to join data across systems and surface correlations you would never spot by hand. Typical first-pass analyses include:
- Job type profitability ranking (which services make money, which do not)
- Customer segment churn risk (which accounts are about to leave)
- Pricing gap analysis (where your quotes are off the market)
- Dispatch efficiency mapping (where techs lose windshield time)
Most AI analytics tools run these analyses weekly and push the results to a dashboard or a Slack channel. You are not training models. You are consuming outputs.
Step 4: Ship One Fix at a Time
The temptation after an audit is to fix everything at once. Do not. Pick the drain with the highest dollar impact and the fastest payback. Ship that fix. Measure. Pick the next one.
A typical sequence for a 20-person service business:
| Week | Fix | Typical Annual Impact |
|---|---|---|
| Week 1 | Tighten upsell scripts on top 3 job types | $20K to $80K |
| Week 2 | Implement automated collections on 30+ day invoices | $15K to $40K (float) |
| Week 3 | Revise pricing on underpriced job types | $30K to $120K |
| Week 4 | Reschedule tech routes for cluster coverage | $25K to $60K (utilization) |
Total typical annual impact: $90K to $300K on a $4M revenue business. None of these fixes require new tools or new hires. They require visibility and discipline.
Decision Table: Manual Audit vs AI Profit Optimization
Most service business owners start with a manual audit (a consultant spending two weeks on site) and then graduate to AI profit optimization. Here is how the two compare.
| Criteria | Manual Audit | AI Profit Optimization |
|---|---|---|
| Time to first insight | 2 to 4 weeks | 3 to 7 days |
| Cost | $8K to $25K per engagement | $300 to $2K per month |
| Ongoing visibility | One-time snapshot | Continuous weekly refresh |
| Cross-system analysis | Limited by analyst bandwidth | Native across CRM, scheduling, accounting |
| Action specificity | General recommendations | Tied to specific jobs, techs, customers |
| Bias toward familiar drains | High (consultant sees what they know) | Low (AI ranks by data) |
| Payback period | 3 to 9 months | 1 to 3 months |
| Best for | Quick gut check, no tools in place | Ongoing operational discipline |
If you have never done any operational audit, start with a manual one to set the baseline. If you have data flowing and need continuous improvement, AI profit optimization is the higher-impact move.
Real Example: A $4.2M HVAC Company That Found $94K in Drains
A 22-person HVAC company in the Southeast came to us convinced their biggest problem was rising labor costs. We ran an AI profit optimization audit on their ServiceTitan, QuickBooks, and Google Business Profile data. Four drains surfaced in the first week.
Drain 1: Underpriced maintenance contracts. Their $189/year maintenance plan had not been repriced in four years. Parts and labor had climbed 22 percent. AI recommended moving the plan to $239 and adding a tiered option. Result: $31K incremental revenue in the first year with zero customer loss.
Drain 2: Missed duct cleaning upsell. Duct cleaning was sold on 11 percent of system replacement jobs. The market average was 38 percent. AI built a technician-specific script and tied it to a follow-up trigger. Result: close rate climbed to 34 percent within 90 days, adding $22K in margin.
Drain 3: Slow collections on commercial accounts. Commercial invoices averaged 52 days to payment. Residential averaged 11. AI flagged the gap and recommended shorter payment terms on new commercial contracts. Result: cycle dropped to 31 days, freeing $41K in working capital.
Drain 4: Dispatch inefficiency in the south zone. Three techs covered overlapping south-zone routes with an average of 38 minutes of windshield time between jobs. AI proposed a cluster reassignment. Result: 14 minutes saved per tech per day, freeing capacity for one extra job per tech per week. Annual impact: $24K in additional revenue without adding headcount.
Total first-year impact: $118K against a $14K investment in tooling and our time. The business owner used the recovered margin to fund a sales hire and a CRM upgrade he had been postponing.
First-Hand Insight From AnovaGrowth
The most consistent pattern we see in service business audits is that owners know their top three problems. They do not know the seventh, eighth, or ninth problem, and those are usually where the largest recoverable dollars live. The visible problems get fixed because everyone is staring at them. The invisible ones persist for years.
AI profit optimization works because it is not anchored to what the owner already thinks. It reads the data cold. That is why the largest drains we find are almost never the ones the owner predicted.
The second pattern is that AI profit optimization pays back fastest on the drains that do not require new tools or new hires. Pricing gaps, upsell scripts, collection timing, route clustering. These are operational discipline problems. Visibility solves them. Tools are secondary.
The third pattern is that profit optimization is not a one-time project. The drains shift once you fix the first round. New drains surface. The work is ongoing. AI is the only realistic way to run it continuously without adding headcount.
If you want a starting point, run a one-week audit on your top five job types. Join your CRM data with your accounting data. Compare quoted-versus-actual hours and quoted-versus-actual prices. That single analysis surfaces more recoverable dollars than most six-figure consulting engagements.
5 Questions Service Business Owners Ask About AI Profit Optimization
1. How is this different from a business coach or consultant?
A business coach works from experience and frameworks. AI profit optimization works from your actual data. The two are complementary. A coach helps you decide what to do with the insights AI surfaces.
2. Do I need to replace my CRM or accounting tools?
No. AI profit optimization sits on top of the tools you already have. The most common stack for our clients is ServiceTitan or Jobber for CRM, Housecall Pro or ServiceTitan for scheduling, and QuickBooks for accounting. AI reads from those and writes insights back.
3. How long until I see the first dollar of impact?
Most clients see the first recovered dollars within 30 days of shipping the first fix. The full payback on the AI investment is usually inside 90 days.
4. What if my data is messy?
Most service business data is messy. AI profit optimization works with messy data. The first pass cleans and joins what it has. The output gets sharper as data quality improves over the next 90 days.
5. Is this only for large service businesses?
No. The framework works for any service business with at least $1M in annual revenue and at least 12 months of CRM and accounting history. Below that, the data volume is too thin for AI to surface meaningful patterns.
Internal Links for Further Reading
- AI Customer Segmentation for Service Businesses - Group customers by value and behavior so your profit optimization effort focuses on the right accounts.
- AI Job Costing for Service Businesses - The data layer that makes profit optimization possible.
- CRM Pipeline Management for Service Businesses - Track deals, forecast revenue, and stop losing opportunities while you optimize.
- Data-Driven Decision Making for Service Businesses - The broader playbook for turning operations data into a competitive advantage.
Key Takeaways
- Most service businesses lose 10 to 30 percent of potential profit to drains nobody is tracking because the data lives in separate systems.
- The seven drains we see most often are missed upsells, slow collections, underpriced jobs, dispatch waste, tech idle time, quiet churn, and quote-to-cash drag.
- AI profit optimization connects CRM, scheduling, and accounting data, then ranks the drains by dollar impact and ships one fix at a time.
- Typical payback is 1 to 3 months on tooling that costs $300 to $2K per month. Annual impact on a $4M business ranges from $90K to $300K.
- The work is ongoing. AI is the only realistic way to run it continuously without adding headcount.
Ready to find the money you are leaving on the table? Contact us to discuss how we can run a profit optimization audit on your service business in 30 days.
Related articles

AI Business Planning Tools for Service Businesses: Build Your Growth Roadmap Without the Guesswork
Most service business owners plan with gut feel and a spreadsheet that is three months out of date. AI planning tools change that. Here is how to use them.
Read the article: AI Business Planning Tools for Service Businesses: Build Your Growth Roadmap Without the Guesswork
AI Analytics and Reporting for Service Businesses: Turn Your CRM Data Into Decisions That Drive Revenue
Most service businesses collect CRM data constantly and use almost none of it. AI analytics turns your existing CRM data into revenue-driving reports without a data team.
Read the article: AI Analytics and Reporting for Service Businesses: Turn Your CRM Data Into Decisions That Drive Revenue
AI Business Valuation for Service Businesses: Know What Your Company Is Actually Worth
Most service business owners guess at their valuation and leave six figures on the table. AI valuation tools turn your CRM, job costing, and operations data into a defensible number you can act on.
Read the article: AI Business Valuation for Service Businesses: Know What Your Company Is Actually Worth
